 |
 |
 |
 |
 |
 |
 |
 |
 |
 |
 |
 |
 |
 |
 |
 |
 |
 |
 |
 |
 |
 |
 |
 |
 |
 |
 |
 |
 |
 |
 |
 |
 |
 |
 |
 |
 |
 |
 |
 |
 |
 |
 |
 |
 |
 |
 |
 |
 |
 |
 |
 |
 |
 |
 |
 |
 |
 |
 |
 |
 |
 |
 |
 |
 |
 |
 |
 |
 |
 |
 |
 |
 |
 |
 |
 |
 |
 |
 |
 |
 |
 |
 |
 |
 |
 |
 |
 |
 |
 |
 |
 |
 |
 |
 |
 |
 |
 |
 |
 |
 |
 |
 |
 |
 |
 |
 |
 |
 |
 |
|
 |
 |
 |
 |
 |
 |
 |
 |
 |
 |
 |
 |
 |
 |
 |
 |
 |
 |
 |
 |
 |
 |
 |
 |
 |
 |
 |
 |
 |
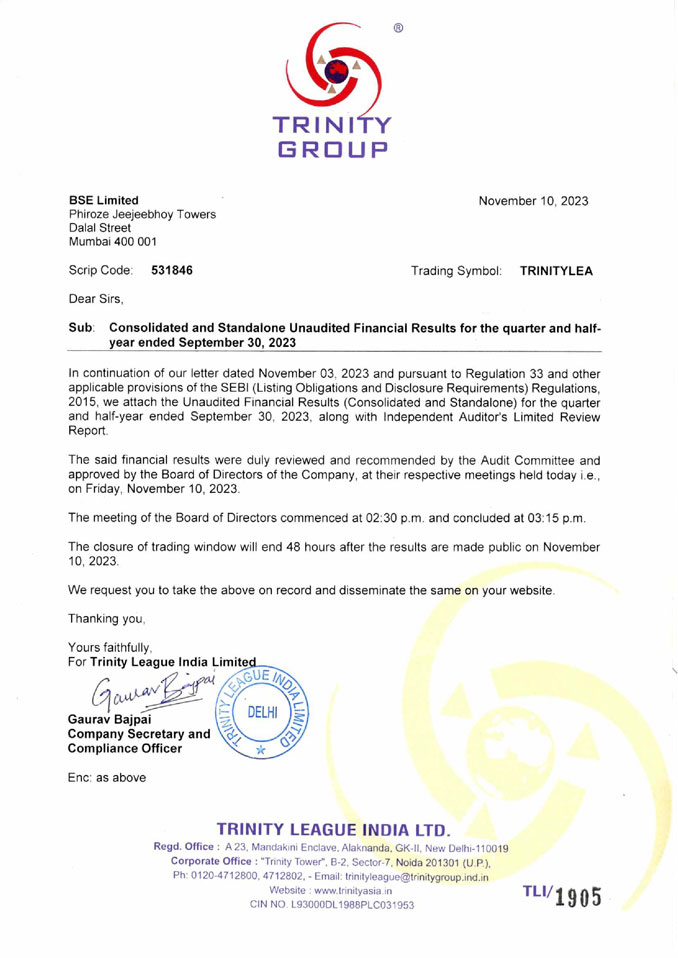
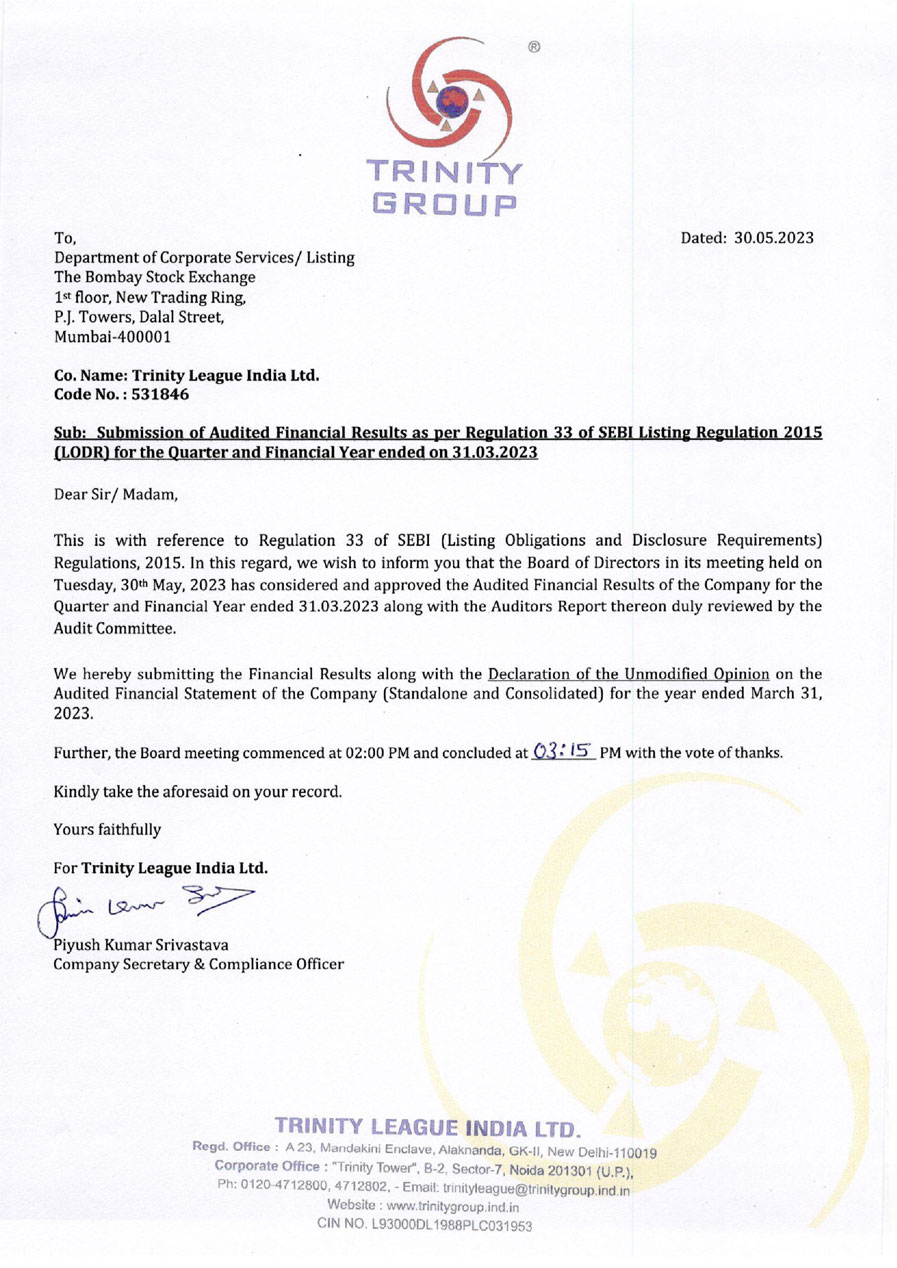
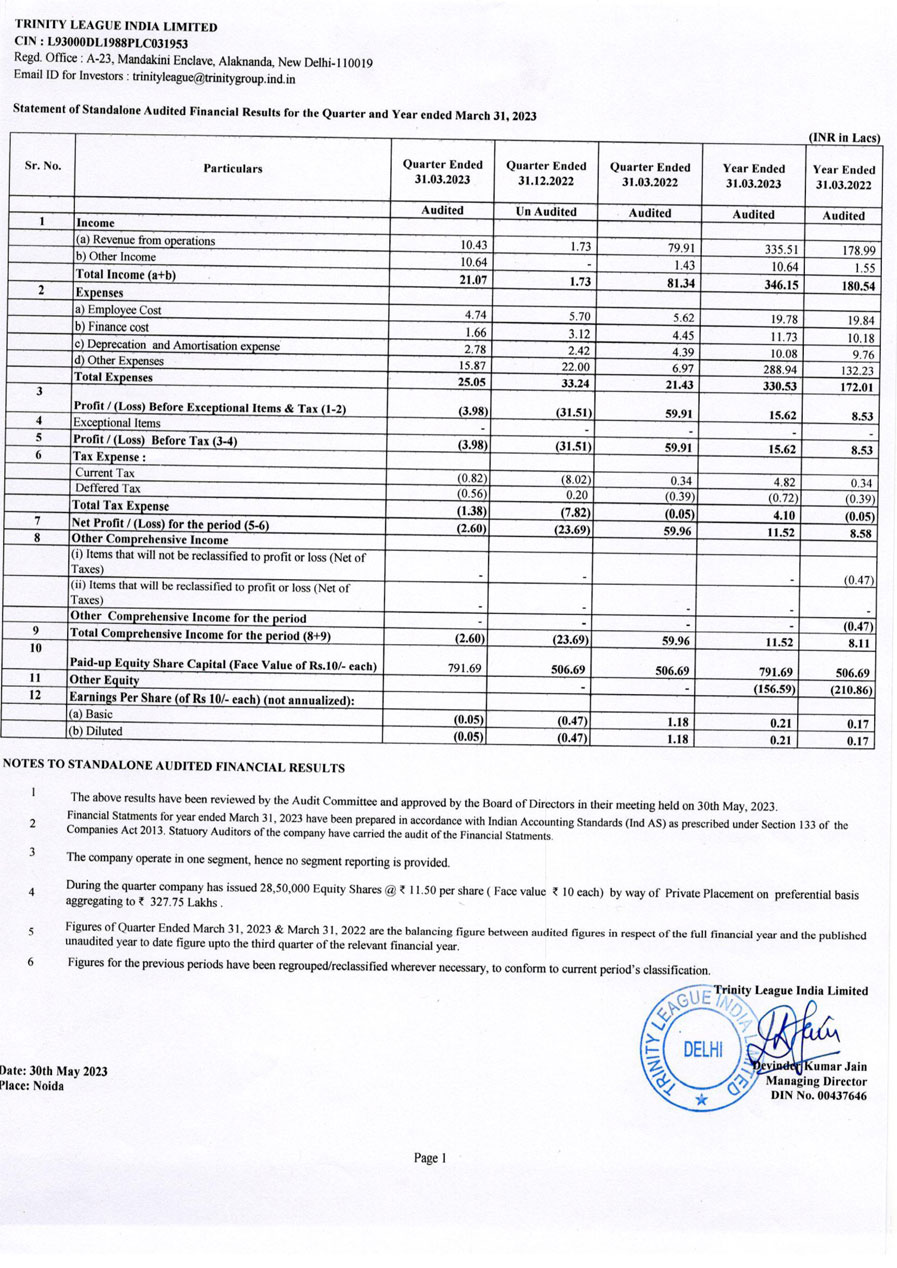
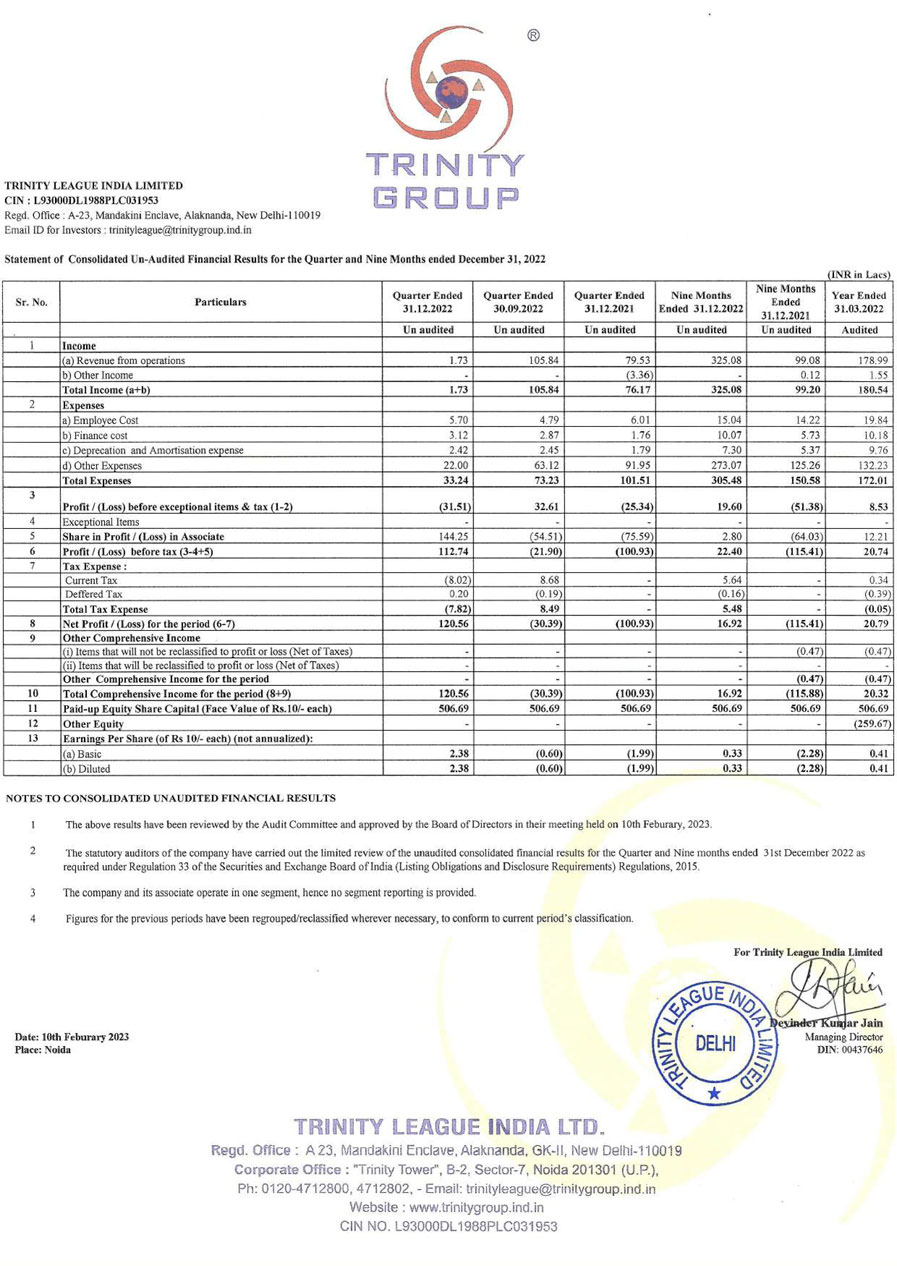
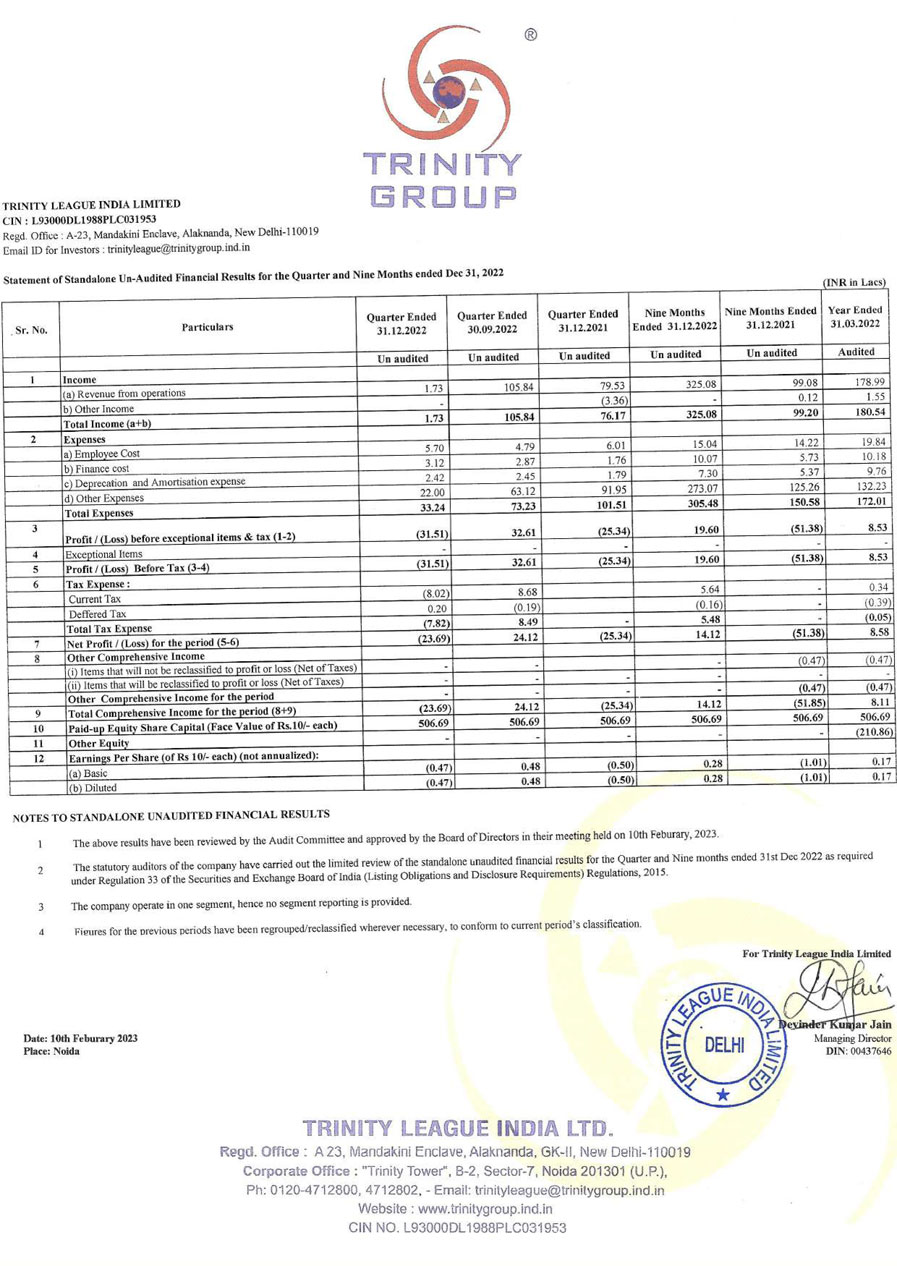
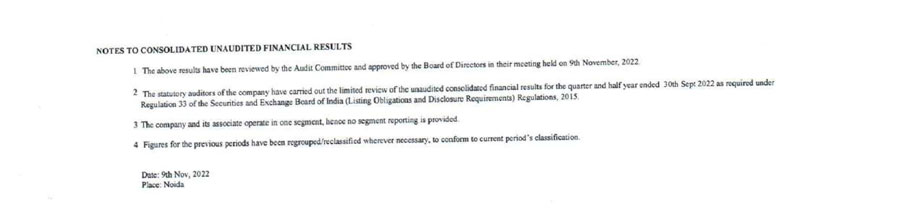
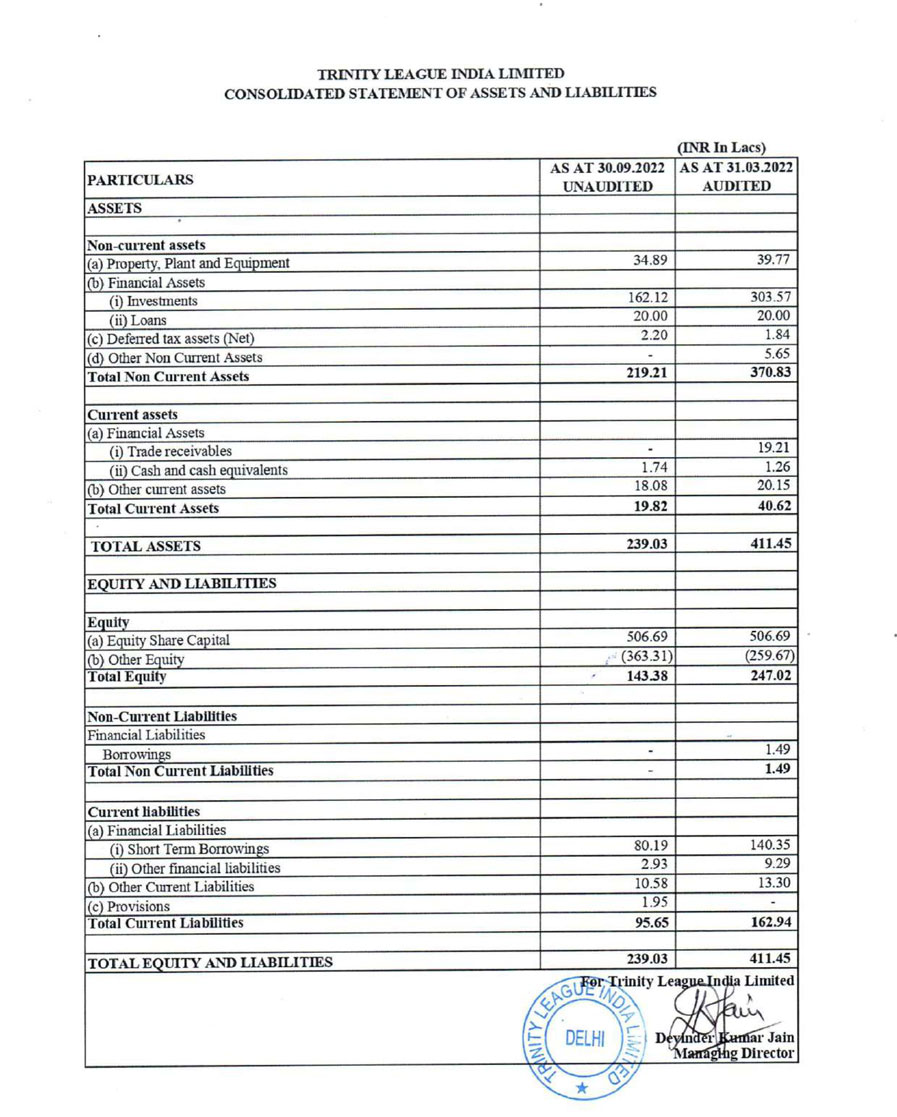
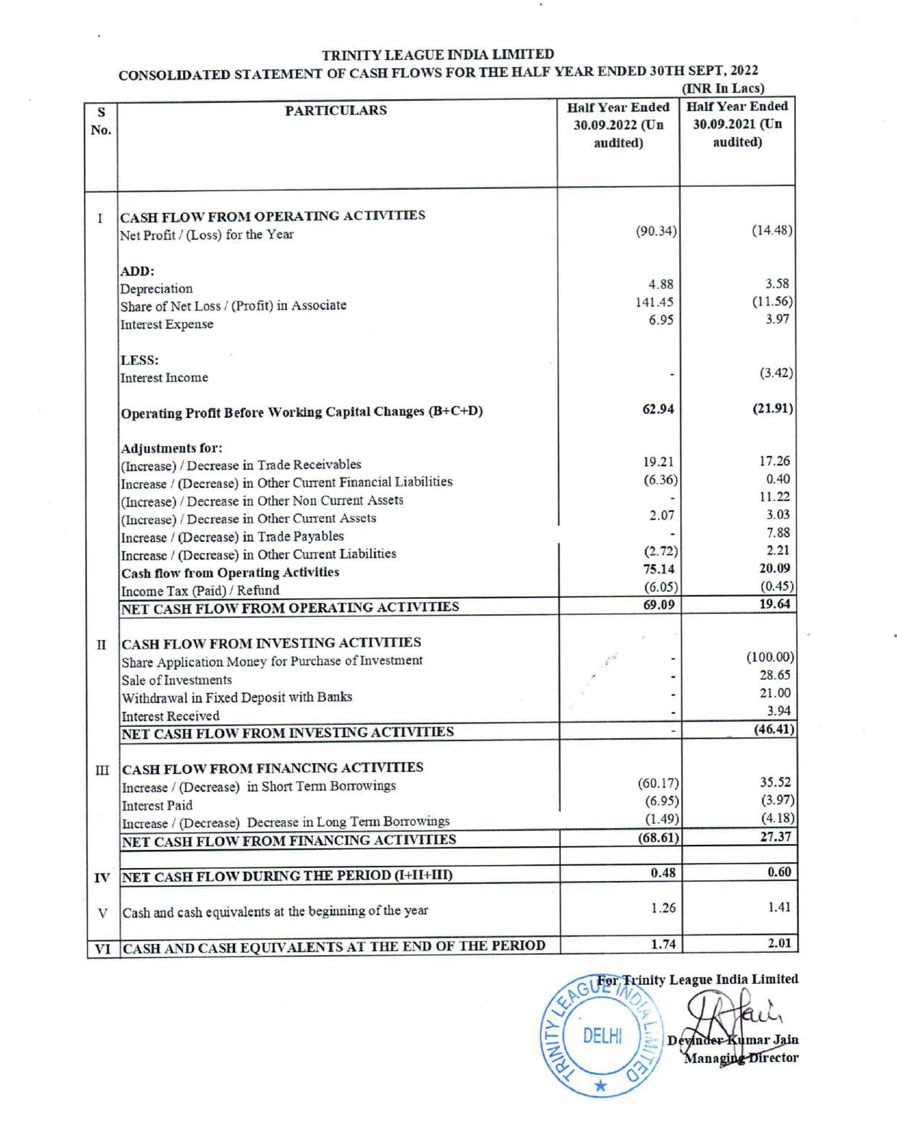
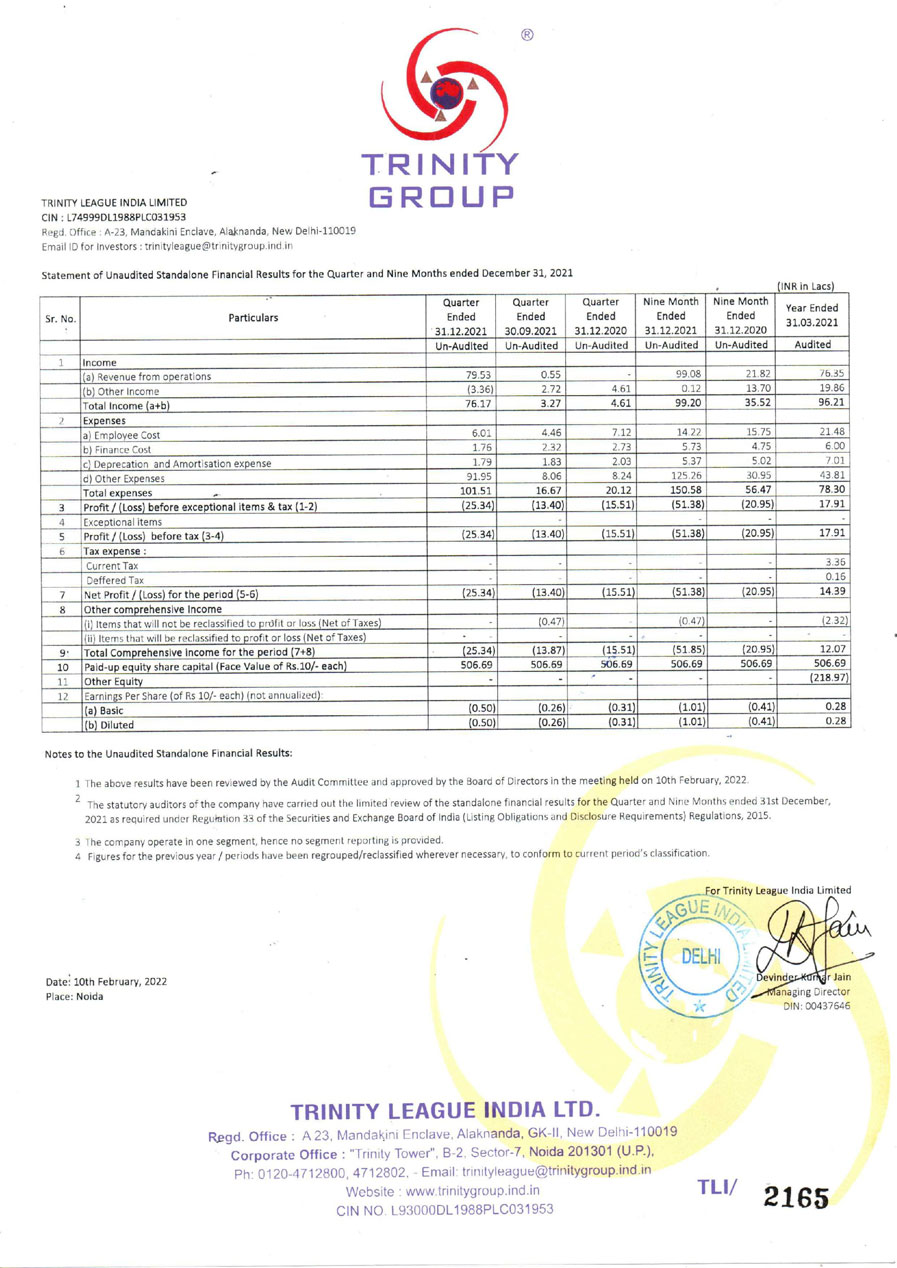
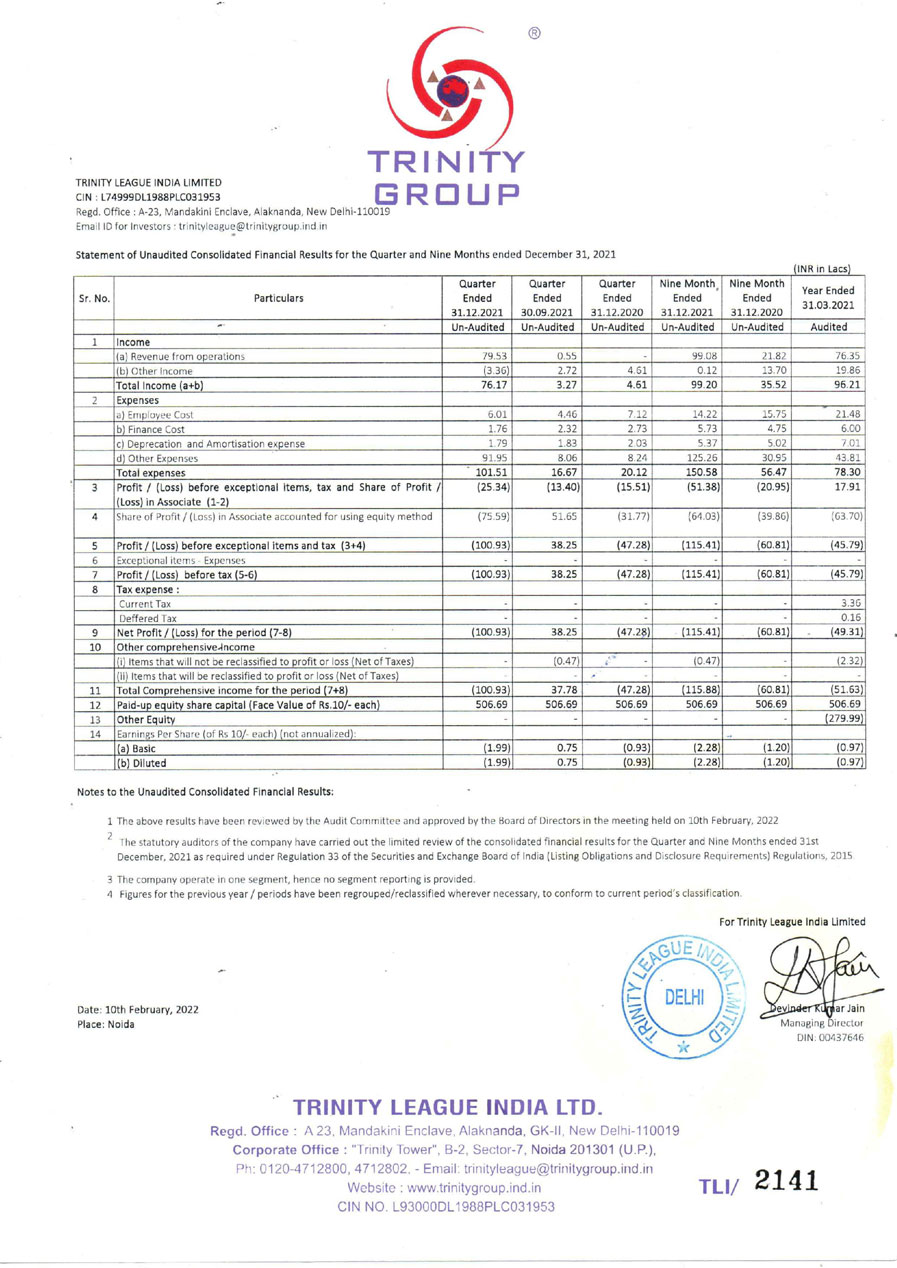
| General information about company |
| Scrip code |
531846 |
|
| NSE Symbol |
|
| MSEI Symbol |
|
| ISIN* |
INE884X01011 |
| Name of company |
TRINITY LEAGUE INDIA LIMITED |
| Class of security |
Equity |
| Date of start of financial year |
01 |
04 |
2019 |
|
| Date of end of financial year |
31 |
03 |
2020 |
| Date of board meeting when results were approved |
26 |
06 |
2020 |
| Date on which prior intimation of the meeting for considering financial results was informed to the exchange |
16 |
06 |
2020 |
| Description of presentation currency |
INR |
|
|
|
| Level of rounding used in financial results |
Lakhs |
Reporting only in "Lakhs", "Millions", "Billions", "Crores" Allowed |
| Reporting Quarter |
Yearly |
|
|
|
| Nature of report standalone or consolidated |
Standalone |
|
|
|
| Whether results are audited or unaudited |
Audited |
For Current Quarter Only |
| Segment Reporting |
Single segment |
|
| Description of single segment |
Business Auxillary Services |
| Start date and time of board meeting |
26-06-2020 |
13 |
15 |
HH:MM |
| End date and time of board meeting |
26-06-2020 |
16 |
35 |
HH:MM |
| Declaration of unmodified opinion or statement on impact of audit qualification |
Declaration of unmodified opinion |
|
|
| |
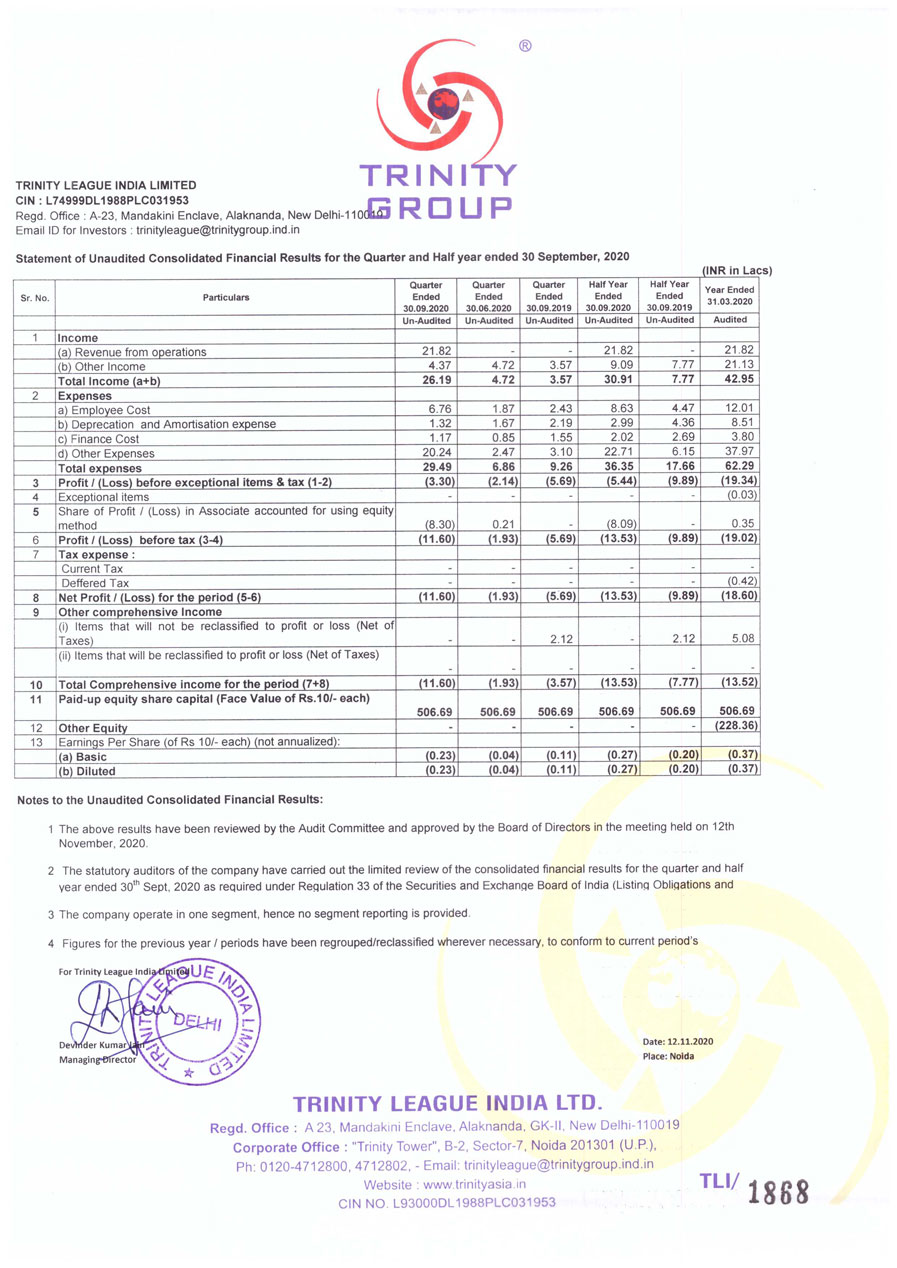
| Financial Results – Ind-AS |
| Particulars |
3 months/ 6 months ended (dd-mm-yyyy) |
Year to date figures for current period ended (dd-mm-yyyy) |
| A |
Date of start of reporting period |
01-01-2020 |
01-04-2019 |
| B |
Date of end of reporting period |
31-03-2020 |
31-03-2020 |
| C |
Whether results are audited or unaudited |
Audited |
Audited |
| D |
Nature of report standalone or consolidated |
Standalone |
Standalone |
| Part I |
Blue color marked fields are non-mandatory. For Consolidated Results, if the company has no figures for 3 months / 6 months ended, in such case zero shall be inserted in the said column. |
| 1 |
Income |
|
| |
Revenue from operations |
21.820 |
21.820 |
| |
Other income |
4.850 |
17.810 |
| |
Total income |
26.670 |
39.630 |
| 2 |
Expenses |
|
| (a) |
Cost of materials consumed |
0.000 |
0.000 |
| (b) |
Purchases of stock-in-trade |
0.000 |
0.000 |
| (c) |
Changes in inventories of finished goods, work-in-progress and stock-in-trade |
0.000 |
0.000 |
| (d) |
Employee benefit expense |
4.300 |
11.230 |
| (e) |
Finance costs |
0.530 |
3.800 |
| (f) |
Depreciation, depletion and amortisation expense |
1.950 |
8.470 |
| (f) |
Other Expenses |
|
| 1 |
Other Expenses |
23.940 |
35.050 |
| 2 |
|
|
|
| 3 |
|
|
|
| 4 |
|
|
|
| 5 |
|
|
|
| 6 |
|
|
|
| 7 |
|
|
|
| 8 |
|
|
|
| 9 |
|
|
|
| 10 |
|
|
|
| |
Total other expenses |
23.940 |
35.050 |
| |
Total expenses |
30.720 |
58.550 |
| 3 |
Total profit before exceptional items and tax |
-4.050 |
-18.920 |
| 4 |
Exceptional items |
0.000 |
0.000 |
| 5 |
Total profit before tax |
-4.050 |
-18.920 |
| 7 |
Tax expense |
|
| 8 |
Current tax |
0.000 |
0.000 |
| 9 |
Deferred tax |
-0.420 |
-0.420 |
| 10 |
Total tax expenses |
-0.420 |
-0.420 |
| 11 |
Net movement in regulatory deferral account balances related to profit or loss and the related deferred tax movement |
0.000 |
0.000 |
| 14 |
Net Profit Loss for the period from continuing operations |
-3.630 |
-18.500 |
| 15 |
Profit (loss) from discontinued operations before tax |
0.000 |
0.000 |
| 16 |
Tax expense of discontinued operations |
0.000 |
0.000 |
| 17 |
Net profit (loss) from discontinued operation after tax |
0.000 |
0.000 |
| 19 |
Share of profit (loss) of associates and joint ventures accounted for using equity method |
0.000 |
0.000 |
| 21 |
Total profit (loss) for period |
-3.630 |
-18.500 |
| 22 |
Other comprehensive income net of taxes |
2.300 |
2.300 |
| 23 |
Total Comprehensive Income for the period |
-1.330 |
-16.200 |
| 24 |
Total profit or loss, attributable to |
|
| |
Profit or loss, attributable to owners of parent |
|
|
| |
Total profit or loss, attributable to non-controlling interests |
|
|
| 25 |
Total Comprehensive income for the period attributable to |
|
| |
Comprehensive income for the period attributable to owners of parent |
0.000 |
0.000 |
| |
Total comprehensive income for the period attributable to owners of parent non-controlling interests |
0.000 |
0.000 |
| 26 |
Details of equity share capital |
|
| |
Paid-up equity share capital |
506.690 |
506.690 |
| |
Face value of equity share capital |
10.000 |
10.000 |
| 27 |
Details of debt securities |
|
| 28 |
Reserves excluding revaluation reserve |
|
-231.040 |
| 29 |
Earnings per share |
|
| i |
Earnings per equity share for continuing operations |
|
| |
Basic earnings (loss) per share from continuing operations |
-0.070 |
0.370 |
| |
Diluted earnings (loss) per share from continuing operations |
-0.070 |
0.370 |
| ii |
Earnings per equity share for discontinued operations |
|
| |
Basic earnings (loss) per share from discontinued operations |
0.000 |
0.000 |
| |
Diluted earnings (loss) per share from discontinued operations |
0.000 |
0.000 |
| ii |
Earnings per equity share |
|
| |
Basic earnings (loss) per share from continuing and discontinued operations |
-0.070 |
0.370 |
| |
Diluted earnings (loss) per share from continuing and discontinued operations |
-0.070 |
0.370 |
| 30 |
Debt equity ratio |
|
|
| 31 |
Debt service coverage ratio |
|
|
| 32 |
Interest service coverage ratio |
|
|
| 33 |
Disclosure of notes on financial results |
|
|
|
| |
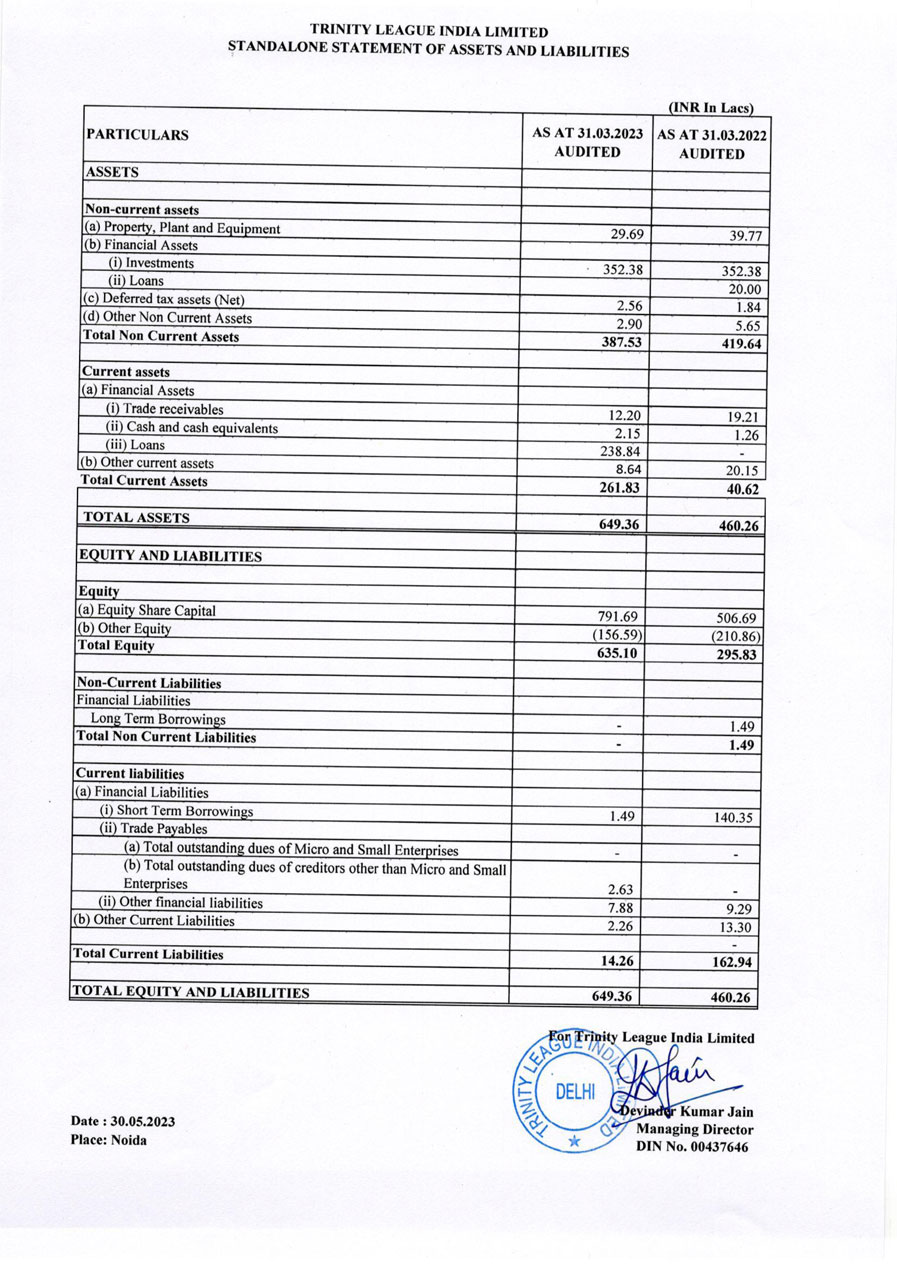
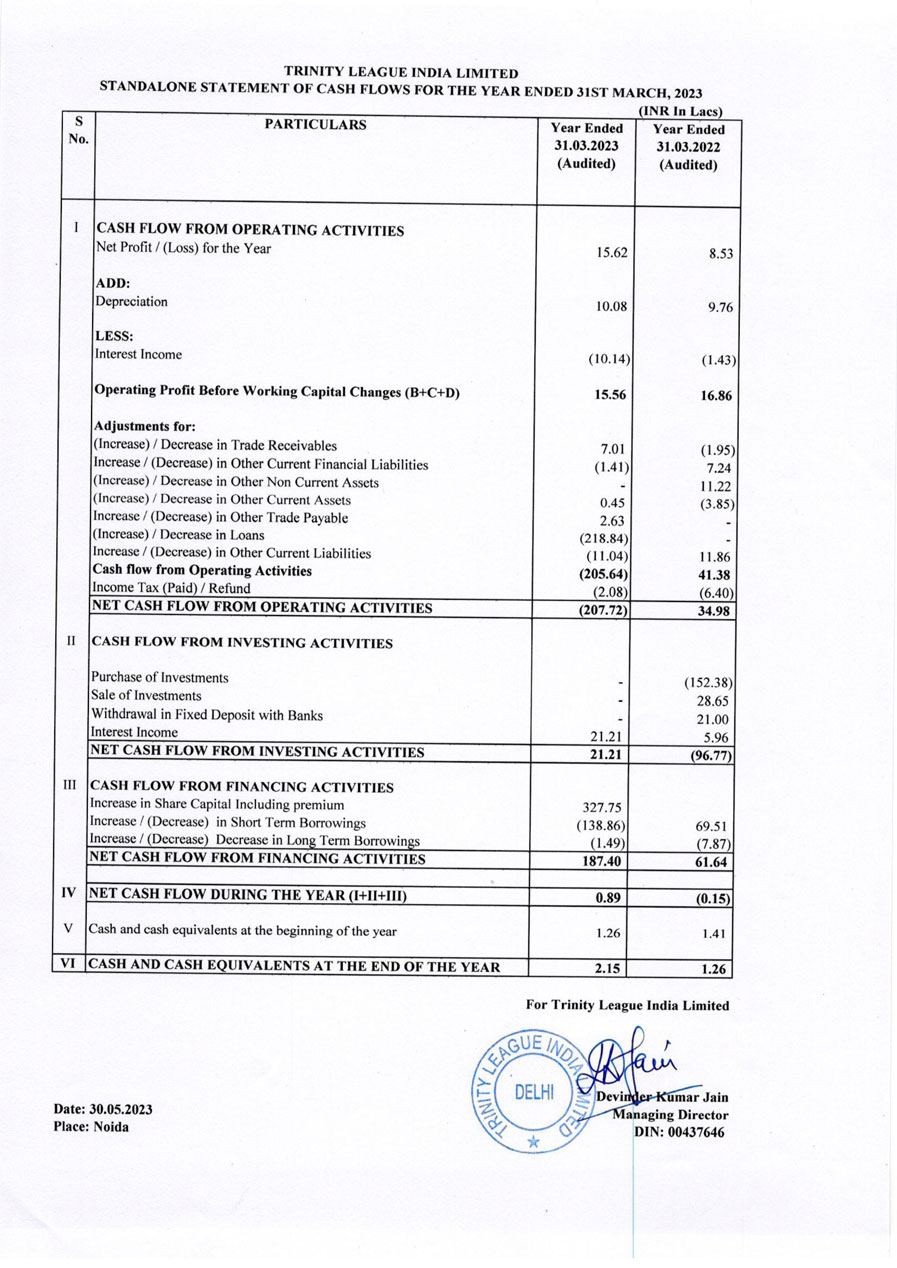
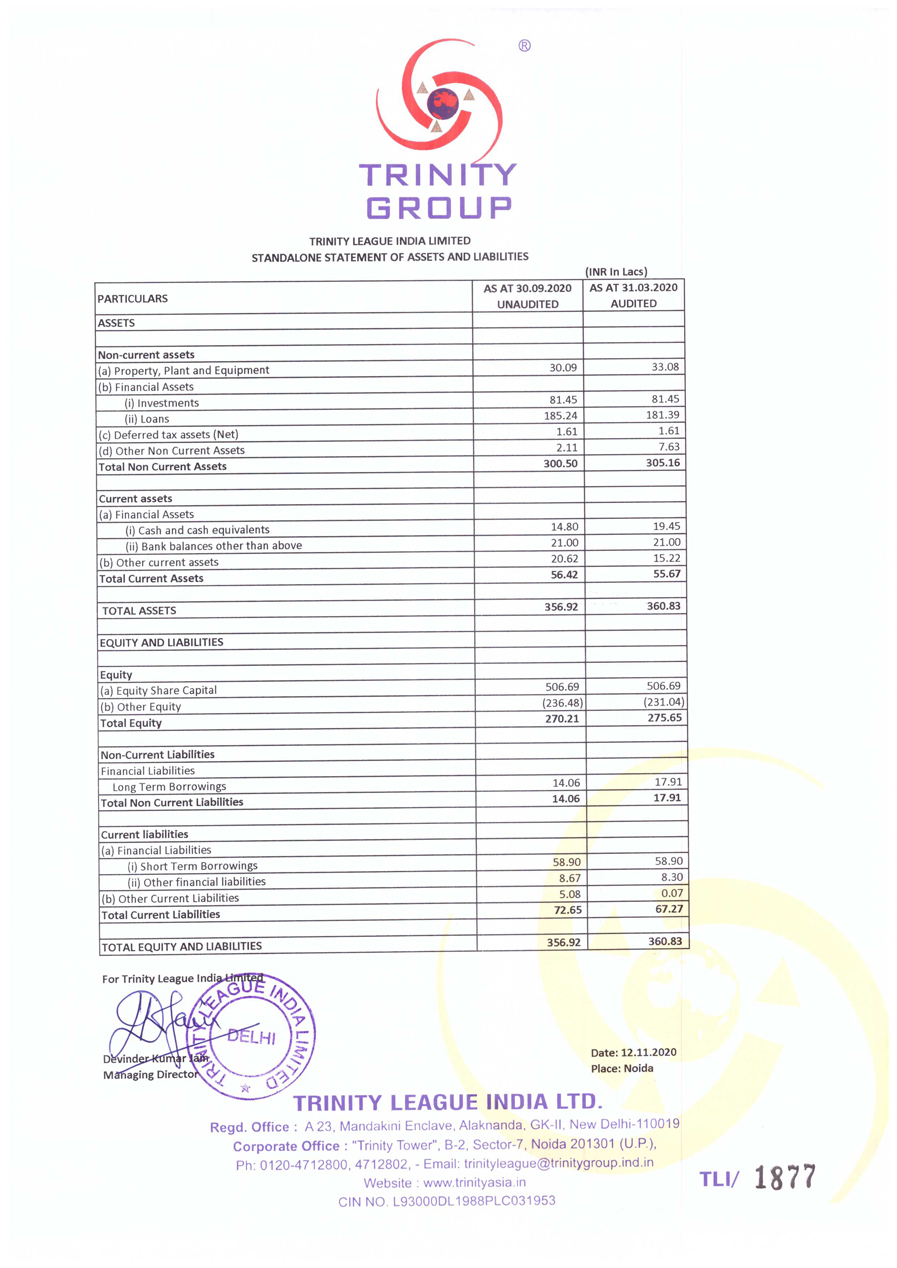
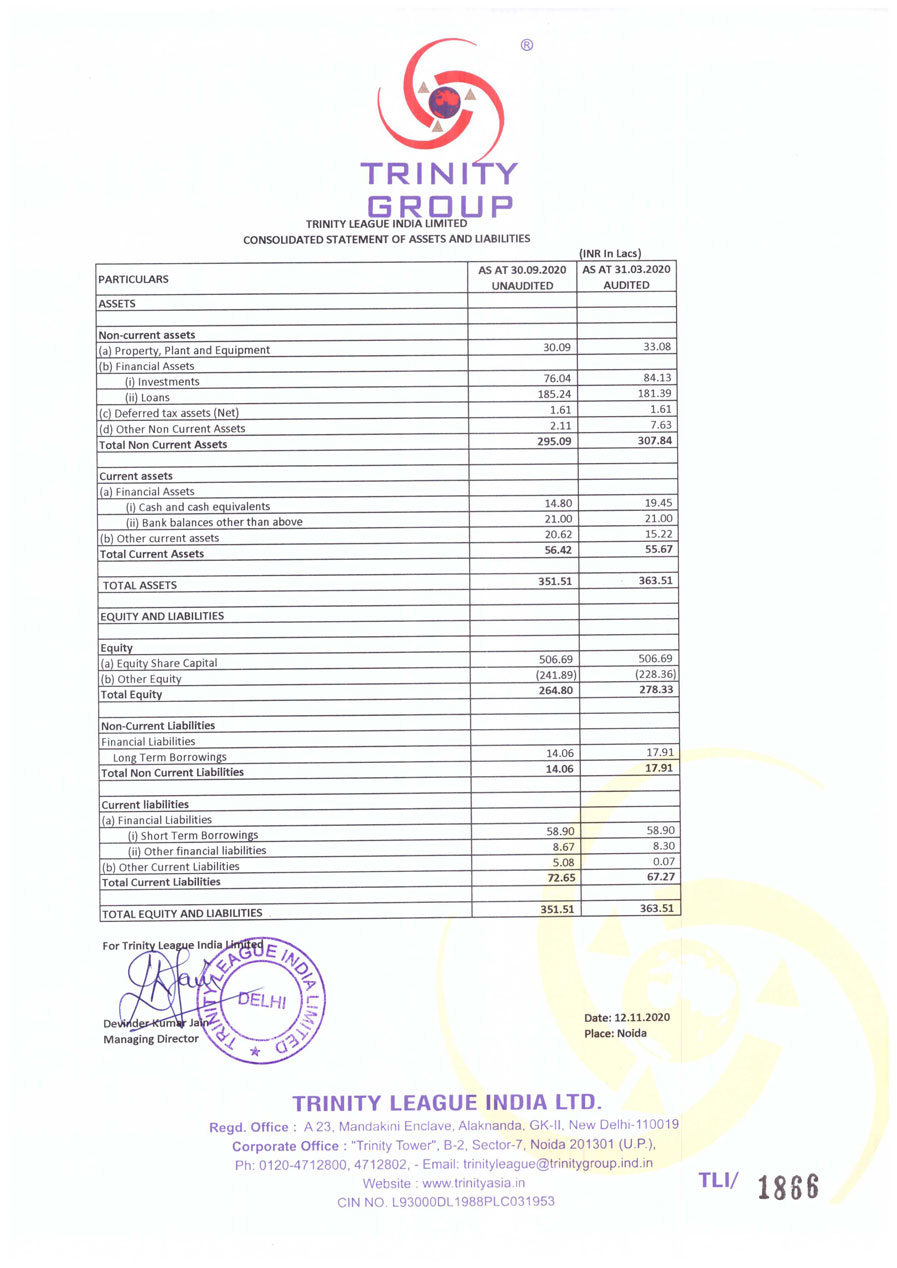
| Statement of Asset and Liabilities |
| Particulars |
Current year ended (dd-mm-yyyy) |
| Date of start of reporting period |
01-04-2019 |
| Date of end of reporting period |
31-03-2020 |
| Whether results are audited or unaudited |
Audited |
| Nature of report standalone or consolidated |
Standalone |
| |
| |
Assets |
|
| 1 |
Non-current assets |
|
| |
Property, plant and equipment |
33.080 |
| |
Capital work-in-progress |
|
| |
Investment property |
|
| |
Goodwill |
0.000 |
| |
Other intangible assets |
0.000 |
| |
Intangible assets under development |
|
| |
Biological assets other than bearer plants |
|
| |
Investments accounted for using equity method |
|
| |
Non-current financial assets |
|
| |
Non-current investments |
81.450 |
| |
Trade receivables, non-current |
|
| |
Loans, non-current |
120.000 |
| |
Other non-current financial assets |
|
| |
Total non-current financial assets |
201.450 |
| |
Deferred tax assets (net) |
1.610 |
| |
Other non-current assets |
69.020 |
| |
Total non-current assets |
305.160 |
| 2 |
Current assets |
|
| |
Inventories |
0.000 |
| |
Current financial asset |
|
| |
Current investments |
0.000 |
| |
Trade receivables, current |
0.000 |
| |
Cash and cash equivalents |
19.450 |
| |
Bank balance other than cash and cash equivalents |
21.000 |
| |
Loans, current |
0.000 |
| |
Other current financial assets |
|
| |
Total current financial assets |
40.450 |
| |
Current tax assets (net) |
|
| |
Other current assets |
15.220 |
| |
Total current assets |
55.670 |
| 3 |
Non-current assets classified as held for sale |
|
| 4 |
Regulatory deferral account debit balances and related deferred tax Assets |
|
| |
Total assets |
360.830 |
| |
Equity and liabilities |
|
| 1 |
Equity |
|
| |
Equity attributable to owners of parent |
|
| |
Equity share capital |
506.690 |
| |
Other equity |
-231.040 |
| |
Total equity attributable to owners of parent |
275.650 |
| |
Non controlling interest |
|
| |
Total equity |
275.650 |
| 2 |
Liabilities |
|
| |
Non-current liabilities |
|
| |
Non-current financial liabilities |
|
| |
Borrowings, non-current |
17.910 |
| |
Trade payables, non-current |
|
| |
Other non-current financial liabilities |
|
| |
Total non-current financial liabilities |
17.910 |
| |
Provisions, non-current |
0.000 |
| |
Deferred tax liabilities (net) |
|
| |
Deferred government grants, Non-current |
|
| |
Other non-current liabilities |
|
| |
Total non-current liabilities |
17.910 |
| |
Current liabilities |
|
| |
Current financial liabilities |
|
| |
Borrowings, current |
58.900 |
| |
Trade payables, current |
0.000 |
| |
Other current financial liabilities |
8.300 |
| |
Total current financial liabilities |
67.200 |
| |
Other current liabilities |
0.070 |
| |
Provisions, current |
0.000 |
| |
Current tax liabilities (Net) |
|
| |
Deferred government grants, Current |
|
| |
Total current liabilities |
67.270 |
| 3 |
Liabilities directly associated with assets in disposal group classified as held for sale |
|
| 4 |
Regulatory deferral account credit balances and related deferred tax liability |
|
| |
Total liabilities |
85.180 |
| |
Total equity and liabilites |
360.830 |
| |
Disclosure of notes on assets and liabilities |
|
|
| |
| Format for Reporting Segmenet wise Revenue, Results and Capital Employed along with the company results |
| Particulars |
3 months/ 6 month ended (dd-mm-yyyy) |
Year to date figures for current period ended (dd-mm-yyyy) |
| Date of start of reporting period |
01-01-2020 |
01-04-2019 |
| Date of end of reporting period |
31-03-2020 |
31-03-2020 |
| Whether accounts are audited or unaudited |
|
|
| Nature of report standalone or consolidated |
Standalone |
Standalone |
| 1 |
Segment Revenue (Income) |
|
| |
(net sale/income from each segment should be disclosed) |
|
| 1 |
|
|
|
| 2 |
|
|
|
| 3 |
|
|
|
| 4 |
|
|
|
| 5 |
|
|
|
| 6 |
|
|
|
| 7 |
|
|
|
| 8 |
|
|
|
| 9 |
|
|
|
| 10 |
|
|
|
| 11 |
|
|
|
| 12 |
|
|
|
| 13 |
|
|
|
| 14 |
|
|
|
| 15 |
|
|
|
| |
Total Segment Revenue |
|
|
| |
Less: Inter segment revenue |
|
|
| |
Revenue from operations |
|
|
|
|
|
|
| 2 |
Segment Result |
|
| |
Profit (+) / Loss (-) before tax and interest from each segment |
|
| 1 |
|
|
|
| 2 |
|
|
|
| 3 |
|
|
|
| 4 |
|
|
|
| 5 |
|
|
|
| 6 |
|
|
|
| 7 |
|
|
|
| 8 |
|
|
|
| 9 |
|
|
|
| 10 |
|
|
|
| 11 |
|
|
|
| 12 |
|
|
|
| 13 |
|
|
|
| 14 |
|
|
|
| 15 |
|
|
|
| |
Total Profit before tax |
|
|
| |
i. Finance cost |
|
|
| |
ii. Other Unallocable Expenditure net off Unallocable income |
|
|
| |
Profit before tax |
|
|
|
|
|
|
| 3 |
(Segment Asset - Segment Liabilities) |
|
| |
Segment Asset |
|
| 1 |
|
|
|
| 2 |
|
|
|
| 3 |
|
|
|
| 4 |
|
|
|
| 5 |
|
|
|
| 6 |
|
|
|
| 7 |
|
|
|
| 8 |
|
|
|
| 9 |
|
|
|
| 10 |
|
|
|
| 11 |
|
|
|
| 12 |
|
|
|
| 13 |
|
|
|
| 14 |
|
|
|
| 15 |
|
|
|
| |
Total Segment Asset |
|
|
| |
Un-allocable Assets |
|
|
| |
Net Segment Asset |
|
|
|
|
|
|
| 4 |
Segment Liabilities |
|
| |
Segment Liabilities |
|
| 1 |
|
|
|
| 2 |
|
|
|
| 3 |
|
|
|
| 4 |
|
|
|
| 5 |
|
|
|
| 6 |
|
|
|
| 7 |
|
|
|
| 8 |
|
|
|
| 9 |
|
|
|
| 10 |
|
|
|
| 11 |
|
|
|
| 12 |
|
|
|
| 13 |
|
|
|
| 14 |
|
|
|
| 15 |
|
|
|
| |
Total Segment Liabilities |
|
|
| |
Un-allocable Liabilities |
|
|
| |
Net Segment Liabilities |
|
|
| |
Disclosure of notes on segments |
|
|
|
| |
| Other Comprehensive Income |
| Particulars |
3 months/ 6 month ended (dd-mm-yyyy) |
Year to date figures for current period ended (dd-mm-yyyy) |
| A |
Date of start of reporting period |
01-01-2020 |
01-04-2019 |
| B |
Date of end of reporting period |
31-03-2020 |
31-03-2020 |
| C |
Whether results are audited or unaudited |
Audited |
Audited |
| D |
Nature of report standalone or consolidated |
Standalone |
Standalone |
| |
Other comprehensive income [Abstract] |
|
| 1 |
Amount of items that will not be reclassified to profit and loss |
|
| 1 |
Items that will not be reclassified to profit or loss (Net of taxes) |
2.300 |
2.300 |
| |
Total Amount of items that will not be reclassified to profit and loss |
2.300 |
2.300 |
| 2 |
Income tax relating to items that will not be reclassified to profit or loss |
0.000 |
0.000 |
| 3 |
Amount of items that will be reclassified to profit and loss |
|
| |
Total Amount of items that will be reclassified to profit and loss |
|
|
| 4 |
Income tax relating to items that will be reclassified to profit or loss |
0.000 |
0.000 |
| 5 |
Total Other comprehensive income |
2.300 |
2.300 |
|
| |
| General information about company |
| |
|
|
| Scrip code |
531846 |
| NSE Symbol |
|
| MSEI Symbol |
|
| ISIN* |
INE884X01011 |
| Name of company |
TRINITY LEAGUE INDIA LTD. |
| Class of security |
Equity |
| Date of start of financial year |
01 |
04 |
2019 |
|
| Date of end of financial year |
31 |
03 |
2020 |
| Date of board meeting when results were approved |
17 |
01 |
2020 |
| Date on which prior intimation of the meeting for considering financial results was informed to the exchange |
09 |
01 |
2020 |
| Description of presentation currency |
INR |
|
|
|
| Level of rounding used in financial results |
Lakhs |
Reporting only in "Lakhs", "Millions", "Billions", "Crores" Allowed |
| Reporting Quarter |
Third quarter |
|
|
|
| Nature of report standalone or consolidated |
Standalone |
|
|
|
| Whether results are audited or unaudited |
Unaudited |
For Current Quarter Only |
| Segment Reporting |
Single segment |
|
| Description of single segment |
Business Auxillary Services |
| Start date and time of board meeting |
17-01-2020 |
13 |
00 |
HH:MM |
| End date and time of board meeting |
17-01-2020 |
17 |
15 |
HH:MM |
| Declaration of unmodified opinion or statement on impact of audit qualification |
Not applicable |
|
|
| Financial Results – Ind-AS |
| Particulars |
3 months/ 6 months ended (dd-mm-yyyy) |
Year to date figures for current period ended (dd-mm-yyyy) |
| A |
Date of start of reporting period |
01-10-2019 |
01-04-2019 |
| B |
Date of end of reporting period |
31-12-2019 |
31-12-2019 |
| C |
Whether results are audited or unaudited |
Unaudited |
Unaudited |
| D |
Nature of report standalone or consolidated |
Standalone |
Standalone |
| Part I |
Blue color marked fields are non-mandatory. For Consolidated Results, if the company has no figures for 3 months / 6 months ended, in such case zero shall be inserted in the said column. |
| 1 |
Income |
|
| |
Revenue from operations |
0.000 |
0.000 |
| |
Other income |
5.190 |
12.960 |
| |
Total income |
5.190 |
12.960 |
| 2 |
Expenses |
|
| (a) |
Cost of materials consumed |
0.000 |
0.000 |
| (b) |
Purchases of stock-in-trade |
0.000 |
0.000 |
| (c) |
Changes in inventories of finished goods, work-in-progress and stock-in-trade |
0.000 |
0.000 |
| (d) |
Employee benefit expense |
2.790 |
6.930 |
| (e) |
Finance costs |
0.580 |
3.270 |
| (f) |
Depreciation, depletion and amortisation expense |
2.180 |
6.520 |
| (f) |
Other Expenses |
|
| 1 |
Other Expenses |
5.290 |
11.110 |
| 2 |
|
|
|
| 3 |
|
|
|
| 4 |
|
|
|
| 5 |
|
|
|
| 6 |
|
|
|
| 7 |
|
|
|
| 8 |
|
|
|
| 9 |
|
|
|
| 10 |
|
|
|
| |
Total other expenses |
5.290 |
11.110 |
| |
Total expenses |
10.840 |
27.830 |
| 3 |
Total profit before exceptional items and tax |
-5.650 |
-14.870 |
| 4 |
Exceptional items |
0.000 |
0.000 |
| 5 |
Total profit before tax |
-5.650 |
-14.870 |
| 7 |
Tax expense |
|
| 8 |
Current tax |
0.000 |
0.000 |
| 9 |
Deferred tax |
0.000 |
0.000 |
| 10 |
Total tax expenses |
0.000 |
0.000 |
| 11 |
Net movement in regulatory deferral account balances related to profit or loss and the related deferred tax movement |
0.000 |
0.000 |
| 14 |
Net Profit Loss for the period from continuing operations |
-5.650 |
-14.870 |
| 15 |
Profit (loss) from discontinued operations before tax |
0.000 |
0.000 |
| 16 |
Tax expense of discontinued operations |
0.000 |
0.000 |
| 17 |
Net profit (loss) from discontinued operation after tax |
0.000 |
0.000 |
| 19 |
Share of profit (loss) of associates and joint ventures accounted for using equity method |
0.000 |
0.000 |
| 21 |
Total profit (loss) for period |
-5.650 |
-14.870 |
| 22 |
Other comprehensive income net of taxes |
0.000 |
0.000 |
| 23 |
Total Comprehensive Income for the period |
-5.650 |
-14.870 |
| 24 |
Total profit or loss, attributable to |
|
| |
Profit or loss, attributable to owners of parent |
|
|
| |
Total profit or loss, attributable to non-controlling interests |
|
|
| 25 |
Total Comprehensive income for the period attributable to |
|
| |
Comprehensive income for the period attributable to owners of parent |
0.000 |
0.000 |
| |
Total comprehensive income for the period attributable to owners of parent non-controlling interests |
0.000 |
0.000 |
| 26 |
Details of equity share capital |
|
| |
Paid-up equity share capital |
506.690 |
506.690 |
| |
Face value of equity share capital |
10.000 |
10.000 |
| 27 |
Details of debt securities |
|
| 28 |
Reserves excluding revaluation reserve |
|
|
| 29 |
Earnings per share |
|
| i |
Earnings per equity share for continuing operations |
|
| |
Basic earnings (loss) per share from continuing operations |
-0.110 |
-0.100 |
| |
Diluted earnings (loss) per share from continuing operations |
-0.110 |
-0.100 |
| ii |
Earnings per equity share for discontinued operations |
|
| |
Basic earnings (loss) per share from discontinued operations |
0.000 |
0.000 |
| |
Diluted earnings (loss) per share from discontinued operations |
0.000 |
0.000 |
| ii |
Earnings per equity share |
|
| |
Basic earnings (loss) per share from continuing and discontinued operations |
-0.110 |
-0.100 |
| |
Diluted earnings (loss) per share from continuing and discontinued operations |
-0.110 |
-0.100 |
| 30 |
Debt equity ratio |
|
|
| 31 |
Debt service coverage ratio |
|
|
| 32 |
Interest service coverage ratio |
|
|
| 33 |
Disclosure of notes on financial results |
|
|
|
| Format for Reporting Segmenet wise Revenue, Results and Capital Employed along with the company results |
| Particulars |
3 months/ 6 month ended (dd-mm-yyyy) |
Year to date figures for current period ended (dd-mm-yyyy) |
| Date of start of reporting period |
01-10-2019 |
01-04-2019 |
| Date of end of reporting period |
31-12-2019 |
31-12-2019 |
| Whether accounts are audited or unaudited |
|
|
| Nature of report standalone or consolidated |
Standalone |
Standalone |
| 1 |
Segment Revenue (Income) |
|
| |
(net sale/income from each segment should be disclosed) |
|
| 1 |
|
|
|
| 2 |
|
|
|
| 3 |
|
|
|
| 4 |
|
|
|
| 5 |
|
|
|
| 6 |
|
|
|
| 7 |
|
|
|
| 8 |
|
|
|
| 9 |
|
|
|
| 10 |
|
|
|
| 11 |
|
|
|
| 12 |
|
|
|
| 13 |
|
|
|
| 14 |
|
|
|
| 15 |
|
|
|
| |
Total Segment Revenue |
|
|
| |
Less: Inter segment revenue |
|
|
| |
Revenue from operations |
|
|
|
|
|
|
| 2 |
Segment Result |
|
| |
Profit (+) / Loss (-) before tax and interest from each segment |
|
| 1 |
|
|
|
| 2 |
|
|
|
| 3 |
|
|
|
| 4 |
|
|
|
| 5 |
|
|
|
| 6 |
|
|
|
| 7 |
|
|
|
| 8 |
|
|
|
| 9 |
|
|
|
| 10 |
|
|
|
| 11 |
|
|
|
| 12 |
|
|
|
| 13 |
|
|
|
| 14 |
|
|
|
| 15 |
|
|
|
| |
Total Profit before tax |
|
|
| |
i. Finance cost |
|
|
| |
ii. Other Unallocable Expenditure net off Unallocable income |
|
|
| |
Profit before tax |
|
|
|
|
|
|
| 3 |
(Segment Asset - Segment Liabilities) |
|
| |
Segment Asset |
|
| 1 |
|
|
|
| 2 |
|
|
|
| 3 |
|
|
|
| 4 |
|
|
|
| 5 |
|
|
|
| 6 |
|
|
|
| 7 |
|
|
|
| 8 |
|
|
|
| 9 |
|
|
|
| 10 |
|
|
|
| 11 |
|
|
|
| 12 |
|
|
|
| 13 |
|
|
|
| 14 |
|
|
|
| 15 |
|
|
|
| |
Total Segment Asset |
|
|
| |
Un-allocable Assets |
|
|
| |
Net Segment Asset |
|
|
|
|
|
|
| 4 |
Segment Liabilities |
|
| |
Segment Liabilities |
|
| 1 |
|
|
|
| 2 |
|
|
|
| 3 |
|
|
|
| 4 |
|
|
|
| 5 |
|
|
|
| 6 |
|
|
|
| 7 |
|
|
|
| 8 |
|
|
|
| 9 |
|
|
|
| 10 |
|
|
|
| 11 |
|
|
|
| 12 |
|
|
|
| 13 |
|
|
|
| 14 |
|
|
|
| 15 |
|
|
|
| |
Total Segment Liabilities |
|
|
| |
Un-allocable Liabilities |
|
|
| |
Net Segment Liabilities |
|
|
| |
Disclosure of notes on segments |
|
|
|
|
|
|
|
| |
| Other Comprehensive Income |
| Particulars |
3 months/ 6 month ended (dd-mm-yyyy) |
Year to date figures for current period ended (dd-mm-yyyy) |
| A |
Date of start of reporting period |
01-10-2019 |
01-04-2019 |
| B |
Date of end of reporting period |
31-12-2019 |
31-12-2019 |
| C |
Whether results are audited or unaudited |
Unaudited |
Unaudited |
| D |
Nature of report standalone or consolidated |
Standalone |
Standalone |
| |
Other comprehensive income [Abstract] |
|
| 1 |
Amount of items that will not be reclassified to profit and loss |
|
| |
Total Amount of items that will not be reclassified to profit and loss |
|
|
| 2 |
Income tax relating to items that will not be reclassified to profit or loss |
|
|
| 3 |
Amount of items that will be reclassified to profit and loss |
|
| |
Total Amount of items that will be reclassified to profit and loss |
|
|
| 4 |
Income tax relating to items that will be reclassified to profit or loss |
|
|
| 5 |
Total Other comprehensive income |
|
|
|
| General information about company |
| Scrip code |
531846 |
|
| NSE Symbol |
|
| MSEI Symbol |
|
| ISIN* |
INE884X01011 |
| Name of company |
TRINITY LEAGUE INDIA LTD. |
| Class of security |
Equity |
| Date of start of financial year |
01 |
04 |
2019 |
|
| Date of end of financial year |
31 |
03 |
2020 |
| Date of board meeting when results were approved |
11 |
11 |
2019 |
| Date on which prior intimation of the meeting for considering financial results was informed to the exchange |
02 |
11 |
2019 |
| Description of presentation currency |
INR |
|
|
|
| Level of rounding used in financial results |
Lakhs |
Reporting only in "Lakhs", "Millions", "Billions", "Crores" Allowed |
| Reporting Quarter |
Half yearly |
|
|
|
| Nature of report standalone or consolidated |
Standalone |
|
|
|
| Whether results are audited or unaudited |
Unaudited |
For Current Quarter Only |
| Segment Reporting |
Single segment |
|
| Description of single segment |
Business Auxillary Services |
| Start date and time of board meeting |
11-11-2019 |
12 |
00 |
HH:MM |
| End date and time of board meeting |
11-11-2019 |
17 |
25 |
HH:MM |
| Declaration of unmodified opinion or statement on impact of audit qualification |
Not applicable |
|
|
| Financial Results – Ind-AS |
| Particulars |
3 months/ 6 months ended (dd-mm-yyyy) |
Year to date figures for current period ended (dd-mm-yyyy) |
| A |
Date of start of reporting period |
01-07-2019 |
01-04-2019 |
| B |
Date of end of reporting period |
30-09-2019 |
30-09-2019 |
| C |
Whether results are audited or unaudited |
Unaudited |
Unaudited |
| D |
Nature of report standalone or consolidated |
Standalone |
Standalone |
| Part I |
Blue color marked fields are non-mandatory. For Consolidated Results, if the company has no figures for 3 months / 6 months ended, in such case zero shall be inserted in the said column. |
| 1 |
Income |
|
| |
Revenue from operations |
0.000 |
0.000 |
| |
Other income |
3.570 |
7.770 |
| |
Total income |
3.570 |
7.770 |
| 2 |
Expenses |
|
| (a) |
Cost of materials consumed |
0.000 |
0.000 |
| (b) |
Purchases of stock-in-trade |
0.000 |
0.000 |
| (c) |
Changes in inventories of finished goods, work-in-progress and stock-in-trade |
0.000 |
0.000 |
| (d) |
Employee benefit expense |
2.100 |
4.140 |
| (e) |
Finance costs |
1.550 |
2.690 |
| (f) |
Depreciation, depletion and amortisation expense |
2.170 |
4.340 |
| (f) |
Other Expenses |
|
| 1 |
other expenses |
2.770 |
5.820 |
| 2 |
|
|
|
| 3 |
|
|
|
| 4 |
|
|
|
| 5 |
|
|
|
| 6 |
|
|
|
| 7 |
|
|
|
| 8 |
|
|
|
| 9 |
|
|
|
| 10 |
|
|
|
| |
Total other expenses |
2.770 |
5.820 |
| |
Total expenses |
8.590 |
16.990 |
| 3 |
Total profit before exceptional items and tax |
-5.020 |
-9.220 |
| 4 |
Exceptional items |
0.000 |
0.000 |
| 5 |
Total profit before tax |
-5.020 |
-9.220 |
| 7 |
Tax expense |
|
| 8 |
Current tax |
0.000 |
0.000 |
| 9 |
Deferred tax |
0.000 |
0.000 |
| 10 |
Total tax expenses |
0.000 |
0.000 |
| 11 |
Net movement in regulatory deferral account balances related to profit or loss and the related deferred tax movement |
0.000 |
0.000 |
| 14 |
Net Profit Loss for the period from continuing operations |
-5.020 |
-9.220 |
| 15 |
Profit (loss) from discontinued operations before tax |
0.000 |
0.000 |
| 16 |
Tax expense of discontinued operations |
0.000 |
0.000 |
| 17 |
Net profit (loss) from discontinued operation after tax |
0.000 |
0.000 |
| 19 |
Share of profit (loss) of associates and joint ventures accounted for using equity method |
0.000 |
0.000 |
| 21 |
Total profit (loss) for period |
-5.020 |
-9.220 |
| 22 |
Other comprehensive income net of taxes |
0.000 |
0.000 |
| 23 |
Total Comprehensive Income for the period |
-5.020 |
-9.220 |
| 24 |
Total profit or loss, attributable to |
|
| |
Profit or loss, attributable to owners of parent |
|
|
| |
Total profit or loss, attributable to non-controlling interests |
|
|
| 25 |
Total Comprehensive income for the period attributable to |
|
| |
Comprehensive income for the period attributable to owners of parent |
0.000 |
0.000 |
| |
Total comprehensive income for the period attributable to owners of parent non-controlling interests |
0.000 |
0.000 |
| 26 |
Details of equity share capital |
|
| |
Paid-up equity share capital |
506.690 |
506.690 |
| |
Face value of equity share capital |
10.000 |
10.000 |
| 27 |
Details of debt securities |
|
| 28 |
Reserves excluding revaluation reserve |
|
|
| 29 |
Earnings per share |
|
| i |
Earnings per equity share for continuing operations |
|
| |
Basic earnings (loss) per share from continuing operations |
-0.100 |
-0.180 |
| |
Diluted earnings (loss) per share from continuing operations |
-0.100 |
-0.180 |
| ii |
Earnings per equity share for discontinued operations |
|
| |
Basic earnings (loss) per share from discontinued operations |
0.000 |
0.000 |
| |
Diluted earnings (loss) per share from discontinued operations |
0.000 |
0.000 |
| ii |
Earnings per equity share |
|
| |
Basic earnings (loss) per share from continuing and discontinued operations |
-0.100 |
-0.180 |
| |
Diluted earnings (loss) per share from continuing and discontinued operations |
-0.100 |
-0.180 |
| 30 |
Debt equity ratio |
|
|
| 31 |
Debt service coverage ratio |
|
|
| 32 |
Interest service coverage ratio |
|
|
| 33 |
Disclosure of notes on financial results |
|
|
|
|
|
|
|
| |
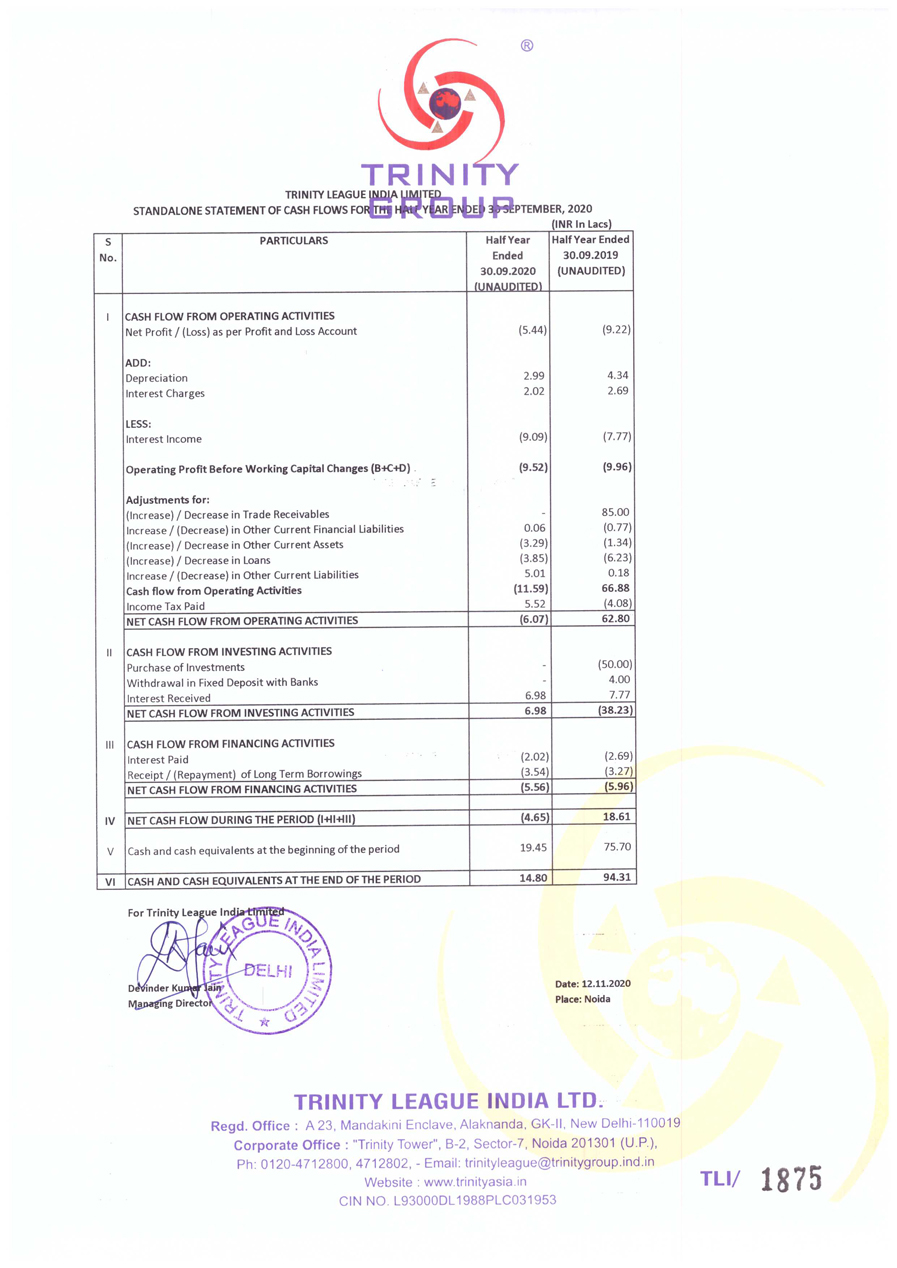
| Statement of Asset and Liabilities |
| Particulars |
Half year ended (dd-mm-yyyy) |
| Date of start of reporting period |
01-04-2019 |
| Date of end of reporting period |
30-09-2019 |
| Whether results are audited or unaudited |
Unaudited |
| Nature of report standalone or consolidated |
Standalone |
| |
| |
Assets |
|
| 1 |
Non-current assets |
|
| |
Property, plant and equipment |
37.130 |
| |
Capital work-in-progress |
|
| |
Investment property |
|
| |
Goodwill |
0.000 |
| |
Other intangible assets |
0.000 |
| |
Intangible assets under development |
|
| |
Biological assets other than bearer plants |
|
| |
Investments accounted for using equity method |
|
| |
Non-current financial assets |
|
| |
Non-current investments |
79.150 |
| |
Trade receivables, non-current |
|
| |
Loans, non-current |
120.000 |
| |
Other non-current financial assets |
|
| |
Total non-current financial assets |
199.150 |
| |
Deferred tax assets (net) |
1.190 |
| |
Other non-current assets |
10.970 |
| |
Total non-current assets |
248.440 |
| 2 |
Current assets |
|
| |
Inventories |
0.000 |
| |
Current financial asset |
|
| |
Current investments |
0.000 |
| |
Trade receivables, current |
0.000 |
| |
Cash and cash equivalents |
94.310 |
| |
Bank balance other than cash and cash equivalents |
21.000 |
| |
Loans, current |
0.000 |
| |
Other current financial assets |
|
| |
Total current financial assets |
115.310 |
| |
Current tax assets (net) |
|
| |
Other current assets |
10.930 |
| |
Total current assets |
126.240 |
| 3 |
Non-current assets classified as held for sale |
|
| 4 |
Regulatory deferral account debit balances and related deferred tax Assets |
|
| |
Total assets |
374.680 |
| |
Equity and liabilities |
|
| 1 |
Equity |
|
| |
Equity attributable to owners of parent |
|
| |
Equity share capital |
506.690 |
| |
Other equity |
-224.060 |
| |
Total equity attributable to owners of parent |
282.630 |
| |
Non controlling interest |
|
| |
Total equity |
282.630 |
| 2 |
Liabilities |
|
| |
Non-current liabilities |
|
| |
Non-current financial liabilities |
|
| |
Borrowings, non-current |
22.410 |
| |
Trade payables, non-current |
|
| |
Other non-current financial liabilities |
|
| |
Total non-current financial liabilities |
22.410 |
| |
Provisions, non-current |
0.000 |
| |
Deferred tax liabilities (net) |
|
| |
Deferred government grants, Non-current |
|
| |
Other non-current liabilities |
|
| |
Total non-current liabilities |
22.410 |
| |
Current liabilities |
|
| |
Current financial liabilities |
|
| |
Borrowings, current |
58.900 |
| |
Trade payables, current |
0.000 |
| |
Other current financial liabilities |
6.150 |
| |
Total current financial liabilities |
65.050 |
| |
Other current liabilities |
4.590 |
| |
Provisions, current |
0.000 |
| |
Current tax liabilities (Net) |
|
| |
Deferred government grants, Current |
|
| |
Total current liabilities |
69.640 |
| 3 |
Liabilities directly associated with assets in disposal group classified as held for sale |
|
| 4 |
Regulatory deferral account credit balances and related deferred tax liability |
|
| |
Total liabilities |
92.050 |
| |
Total equity and liabilites |
374.680 |
| |
Disclosure of notes on assets and liabilities |
|
|
|
|
|
| |
| Format for Reporting Segmenet wise Revenue, Results and Capital Employed along with the company results |
| Particulars |
3 months/ 6 month ended (dd-mm-yyyy) |
Year to date figures for current period ended (dd-mm-yyyy) |
| Date of start of reporting period |
01-07-2019 |
01-04-2019 |
| Date of end of reporting period |
30-09-2019 |
30-09-2019 |
| Whether accounts are audited or unaudited |
|
|
| Nature of report standalone or consolidated |
Standalone |
Standalone |
| 1 |
Segment Revenue (Income) |
|
| |
(net sale/income from each segment should be disclosed) |
|
| 1 |
|
|
|
| 2 |
|
|
|
| 3 |
|
|
|
| 4 |
|
|
|
| 5 |
|
|
|
| 6 |
|
|
|
| 7 |
|
|
|
| 8 |
|
|
|
| 9 |
|
|
|
| 10 |
|
|
|
| 11 |
|
|
|
| 12 |
|
|
|
| 13 |
|
|
|
| 14 |
|
|
|
| 15 |
|
|
|
| |
Total Segment Revenue |
|
|
| |
Less: Inter segment revenue |
|
|
| |
Revenue from operations |
|
|
|
|
|
|
| 2 |
Segment Result |
|
| |
Profit (+) / Loss (-) before tax and interest from each segment |
|
| 1 |
|
|
|
| 2 |
|
|
|
| 3 |
|
|
|
| 4 |
|
|
|
| 5 |
|
|
|
| 6 |
|
|
|
| 7 |
|
|
|
| 8 |
|
|
|
| 9 |
|
|
|
| 10 |
|
|
|
| 11 |
|
|
|
| 12 |
|
|
|
| 13 |
|
|
|
| 14 |
|
|
|
| 15 |
|
|
|
| |
Total Profit before tax |
|
|
| |
i. Finance cost |
|
|
| |
ii. Other Unallocable Expenditure net off Unallocable income |
|
|
| |
Profit before tax |
|
|
|
|
|
|
| 3 |
(Segment Asset - Segment Liabilities) |
|
| |
Segment Asset |
|
| 1 |
|
|
|
| 2 |
|
|
|
| 3 |
|
|
|
| 4 |
|
|
|
| 5 |
|
|
|
| 6 |
|
|
|
| 7 |
|
|
|
| 8 |
|
|
|
| 9 |
|
|
|
| 10 |
|
|
|
| 11 |
|
|
|
| 12 |
|
|
|
| 13 |
|
|
|
| 14 |
|
|
|
| 15 |
|
|
|
| |
Total Segment Asset |
|
|
| |
Un-allocable Assets |
|
|
| |
Net Segment Asset |
|
|
|
|
|
|
| 4 |
Segment Liabilities |
|
| |
Segment Liabilities |
|
| 1 |
|
|
|
| 2 |
|
|
|
| 3 |
|
|
|
| 4 |
|
|
|
| 5 |
|
|
|
| 6 |
|
|
|
| 7 |
|
|
|
| 8 |
|
|
|
| 9 |
|
|
|
| 10 |
|
|
|
| 11 |
|
|
|
| 12 |
|
|
|
| 13 |
|
|
|
| 14 |
|
|
|
| 15 |
|
|
|
| |
Total Segment Liabilities |
|
|
| |
Un-allocable Liabilities |
|
|
| |
Net Segment Liabilities |
|
|
| |
Disclosure of notes on segments |
|
|
|
|
|
|
|
| |
| Other Comprehensive Income |
| Particulars |
3 months/ 6 month ended (dd-mm-yyyy) |
Year to date figures for current period ended (dd-mm-yyyy) |
| A |
Date of start of reporting period |
01-07-2019 |
01-04-2019 |
| B |
Date of end of reporting period |
30-09-2019 |
30-09-2019 |
| C |
Whether results are audited or unaudited |
Unaudited |
Unaudited |
| D |
Nature of report standalone or consolidated |
Standalone |
Standalone |
| |
Other comprehensive income [Abstract] |
|
| 1 |
Amount of items that will not be reclassified to profit and loss |
|
| |
Total Amount of items that will not be reclassified to profit and loss |
|
|
| 2 |
Income tax relating to items that will not be reclassified to profit or loss |
0.000 |
0.000 |
| 3 |
Amount of items that will be reclassified to profit and loss |
|
| |
Total Amount of items that will be reclassified to profit and loss |
|
|
| 4 |
Income tax relating to items that will be reclassified to profit or loss |
0.000 |
0.000 |
| 5 |
Total Other comprehensive income |
0.000 |
0.000 |
|
| General information about company |
| Scrip code |
531846 |
|
| NSE Symbol |
|
| MSEI Symbol |
|
| ISIN* |
INE884X01011 |
| Name of company |
TRINITY LEAGUE INDIA LTD. |
| Class of security |
Equity |
| Date of start of financial year |
01 |
04 |
2019 |
|
| Date of end of financial year |
31 |
03 |
2020 |
| Date of board meeting when results were approved |
27 |
07 |
2019 |
| Date on which prior intimation of the meeting for considering financial results was informed to the exchange |
19 |
07 |
2019 |
| Description of presentation currency |
INR |
|
|
|
| Level of rounding used in financial results |
Lakhs |
Reporting only in "Lakhs", "Millions", "Billions", "Crores" Allowed |
| Reporting Quarter |
First quarter |
|
|
|
| Nature of report standalone or consolidated |
Standalone |
|
|
|
| Whether results are audited or unaudited |
Unaudited |
For Current Quarter Only |
| Segment Reporting |
Single segment |
|
| Description of single segment |
Business Auxillary Services |
| Start date and time of board meeting |
27-07-2019 |
01 |
00 |
HH:MM |
| End date and time of board meeting |
27-07-2019 |
04 |
30 |
HH:MM |
| Declaration of unmodified opinion or statement on impact of audit qualification |
Not applicable |
|
|
| Financial Results – Ind-AS |
| Particulars |
3 months/ 6 months ended (dd-mm-yyyy) |
Year to date figures for current period ended (dd-mm-yyyy) |
| A |
Date of start of reporting period |
01-04-2019 |
01-04-2019 |
| B |
Date of end of reporting period |
30-06-2019 |
30-06-2019 |
| C |
Whether results are audited or unaudited |
Unaudited |
Unaudited |
| D |
Nature of report standalone or consolidated |
Standalone |
Standalone |
| Part I |
Blue color marked fields are non-mandatory. For Consolidated Results, if the company has no figures for 3 months / 6 months ended, in such case zero shall be inserted in the said column. |
| 1 |
Income |
|
| |
Revenue from operations |
0.000 |
0.000 |
| |
Other income |
4.200 |
4.200 |
| |
Total income |
4.200 |
4.200 |
| 2 |
Expenses |
|
| (a) |
Cost of materials consumed |
0.000 |
0.000 |
| (b) |
Purchases of stock-in-trade |
0.000 |
0.000 |
| (c) |
Changes in inventories of finished goods, work-in-progress and stock-in-trade |
0.000 |
0.000 |
| (d) |
Employee benefit expense |
2.040 |
2.040 |
| (e) |
Finance costs |
1.140 |
1.140 |
| (f) |
Depreciation, depletion and amortisation expense |
2.170 |
2.170 |
| (f) |
Other Expenses |
|
| 1 |
Administrative Expense |
3.050 |
3.050 |
| 2 |
|
|
|
| 3 |
|
|
|
| 4 |
|
|
|
| 5 |
|
|
|
| 6 |
|
|
|
| 7 |
|
|
|
| 8 |
|
|
|
| 9 |
|
|
|
| 10 |
|
|
|
| |
Total other expenses |
3.050 |
3.050 |
| |
Total expenses |
8.400 |
8.400 |
| 3 |
Total profit before exceptional items and tax |
-4.200 |
-4.200 |
| 4 |
Exceptional items |
0.000 |
0.000 |
| 5 |
Total profit before tax |
-4.200 |
-4.200 |
| 7 |
Tax expense |
|
| 8 |
Current tax |
0.000 |
0.000 |
| 9 |
Deferred tax |
0.000 |
0.000 |
| 10 |
Total tax expenses |
0.000 |
0.000 |
| 11 |
Net movement in regulatory deferral account balances related to profit or loss and the related deferred tax movement |
0.000 |
0.000 |
| 14 |
Net Profit Loss for the period from continuing operations |
-4.200 |
-4.200 |
| 15 |
Profit (loss) from discontinued operations before tax |
0.000 |
0.000 |
| 16 |
Tax expense of discontinued operations |
0.000 |
0.000 |
| 17 |
Net profit (loss) from discontinued operation after tax |
0.000 |
0.000 |
| 19 |
Share of profit (loss) of associates and joint ventures accounted for using equity method |
0.000 |
0.000 |
| 21 |
Total profit (loss) for period |
-4.200 |
-4.200 |
| 22 |
Other comprehensive income net of taxes |
0.000 |
0.000 |
| 23 |
Total Comprehensive Income for the period |
-4.200 |
-4.200 |
| 24 |
Total profit or loss, attributable to |
|
| |
Profit or loss, attributable to owners of parent |
|
|
| |
Total profit or loss, attributable to non-controlling interests |
|
|
| 25 |
Total Comprehensive income for the period attributable to |
|
| |
Comprehensive income for the period attributable to owners of parent |
0.000 |
0.000 |
| |
Total comprehensive income for the period attributable to owners of parent non-controlling interests |
0.000 |
0.000 |
| 26 |
Details of equity share capital |
|
| |
Paid-up equity share capital |
506.690 |
506.690 |
| |
Face value of equity share capital |
10.000 |
10.000 |
| 27 |
Details of debt securities |
|
| 28 |
Reserves excluding revaluation reserve |
|
|
| 29 |
Earnings per share |
|
| i |
Earnings per equity share for continuing operations |
|
| |
Basic earnings (loss) per share from continuing operations |
-0.080 |
-0.080 |
| |
Diluted earnings (loss) per share from continuing operations |
-0.080 |
-0.080 |
| ii |
Earnings per equity share for discontinued operations |
|
| |
Basic earnings (loss) per share from discontinued operations |
0.000 |
0.000 |
| |
Diluted earnings (loss) per share from discontinued operations |
0.000 |
0.000 |
| ii |
Earnings per equity share |
|
| |
Basic earnings (loss) per share from continuing and discontinued operations |
-0.080 |
-0.080 |
| |
Diluted earnings (loss) per share from continuing and discontinued operations |
-0.080 |
-0.080 |
| 30 |
Debt equity ratio |
|
|
| 31 |
Debt service coverage ratio |
|
|
| 32 |
Interest service coverage ratio |
|
|
| 33 |
Disclosure of notes on financial results |
|
|
|
|
|
|
|
| Format for Reporting Segmenet wise Revenue, Results and Capital Employed along with the company results |
| Particulars |
3 months/ 6 month ended (dd-mm-yyyy) |
Year to date figures for current period ended (dd-mm-yyyy) |
| Date of start of reporting period |
01-04-2019 |
01-04-2019 |
| Date of end of reporting period |
30-06-2019 |
30-06-2019 |
| Whether accounts are audited or unaudited |
|
|
| Nature of report standalone or consolidated |
Standalone |
Standalone |
| 1 |
Segment Revenue (Income) |
|
| |
(net sale/income from each segment should be disclosed) |
|
| 1 |
|
|
|
| 2 |
|
|
|
| 3 |
|
|
|
| 4 |
|
|
|
| 5 |
|
|
|
| 6 |
|
|
|
| 7 |
|
|
|
| 8 |
|
|
|
| 9 |
|
|
|
| 10 |
|
|
|
| 11 |
|
|
|
| 12 |
|
|
|
| 13 |
|
|
|
| 14 |
|
|
|
| 15 |
|
|
|
| |
Total Segment Revenue |
|
|
| |
Less: Inter segment revenue |
|
|
| |
Revenue from operations |
|
|
|
|
|
|
| 2 |
Segment Result |
|
| |
Profit (+) / Loss (-) before tax and interest from each segment |
|
| 1 |
|
|
|
| 2 |
|
|
|
| 3 |
|
|
|
| 4 |
|
|
|
| 5 |
|
|
|
| 6 |
|
|
|
| 7 |
|
|
|
| 8 |
|
|
|
| 9 |
|
|
|
| 10 |
|
|
|
| 11 |
|
|
|
| 12 |
|
|
|
| 13 |
|
|
|
| 14 |
|
|
|
| 15 |
|
|
|
| |
Total Profit before tax |
|
|
| |
i. Finance cost |
|
|
| |
ii. Other Unallocable Expenditure net off Unallocable income |
|
|
| |
Profit before tax |
|
|
|
|
|
|
| 3 |
(Segment Asset - Segment Liabilities) |
|
| |
Segment Asset |
|
| 1 |
|
|
|
| 2 |
|
|
|
| 3 |
|
|
|
| 4 |
|
|
|
| 5 |
|
|
|
| 6 |
|
|
|
| 7 |
|
|
|
| 8 |
|
|
|
| 9 |
|
|
|
| 10 |
|
|
|
| 11 |
|
|
|
| 12 |
|
|
|
| 13 |
|
|
|
| 14 |
|
|
|
| 15 |
|
|
|
| |
Total Segment Asset |
|
|
| |
Un-allocable Assets |
|
|
| |
Net Segment Asset |
|
|
|
|
|
|
| 4 |
Segment Liabilities |
|
| |
Segment Liabilities |
|
| 1 |
|
|
|
| 2 |
|
|
|
| 3 |
|
|
|
| 4 |
|
|
|
| 5 |
|
|
|
| 6 |
|
|
|
| 7 |
|
|
|
| 8 |
|
|
|
| 9 |
|
|
|
| 10 |
|
|
|
| 11 |
|
|
|
| 12 |
|
|
|
| 13 |
|
|
|
| 14 |
|
|
|
| 15 |
|
|
|
| |
Total Segment Liabilities |
|
|
| |
Un-allocable Liabilities |
|
|
| |
Net Segment Liabilities |
|
|
| |
Disclosure of notes on segments |
|
|
|
|
|
|
|
| |
| General information about company |
| Scrip code |
531846 |
|
| NSE Symbol |
|
| MSEI Symbol |
|
| ISIN* |
INE884X01011 |
| Name of company |
TRINITY LEAGUE INDIA LTD. |
| Class of security |
Equity |
| Date of start of financial year |
01 |
04 |
2018 |
|
| Date of end of financial year |
31 |
03 |
2019 |
| Date of board meeting when results were approved |
08 |
05 |
2019 |
| Date on which prior intimation of the meeting for considering financial results was informed to the exchange |
27 |
04 |
2019 |
| Description of presentation currency |
INR |
|
|
|
| Level of rounding used in financial results |
Lakhs |
Reporting only in "Lakhs", "Millions", "Billions", "Crores" Allowed |
| Reporting Quarter |
Yearly |
|
|
|
| Nature of report standalone or consolidated |
Standalone |
|
|
|
| Whether results are audited or unaudited |
Audited |
For Current Quarter Only |
| Segment Reporting |
Single segment |
|
| Description of single segment |
Business Auxillary Services |
| Start date and time of board meeting |
08-05-2019 |
01 |
00 |
HH:MM |
| End date and time of board meeting |
08-05-2019 |
05 |
25 |
HH:MM |
| Declaration of unmodified opinion or statement on impact of audit qualification |
Declaration of unmodified opinion |
|
|
| |
| Financial Results – Ind-AS |
| Particulars |
3 months/ 6 months ended (dd-mm-yyyy) |
Year to date figures for current period ended (dd-mm-yyyy) |
| A |
Date of start of reporting period |
01-01-2019 |
01-04-2018 |
| B |
Date of end of reporting period |
31-03-2019 |
31-03-2019 |
| C |
Whether results are audited or unaudited |
Audited |
Audited |
| D |
Nature of report standalone or consolidated |
Standalone |
Standalone |
| Part I |
Blue color marked fields are non-mandatory. For Consolidated Results, if the company has no figures for 3 months / 6 months ended, in such case zero shall be inserted in the said column. |
| 1 |
Income |
|
| |
Revenue from operations |
63.100 |
84.870 |
| |
Other income |
3.840 |
10.240 |
| |
Total income |
66.940 |
95.110 |
| 2 |
Expenses |
|
| (a) |
Cost of materials consumed |
0.000 |
0.000 |
| (b) |
Purchases of stock-in-trade |
0.000 |
0.000 |
| (c) |
Changes in inventories of finished goods, work-in-progress and stock-in-trade |
0.000 |
0.000 |
| (d) |
Employee benefit expense |
2.650 |
28.210 |
| (e) |
Finance costs |
1.110 |
3.110 |
| (f) |
Depreciation, depletion and amortisation expense |
2.170 |
8.060 |
| (f) |
Other Expenses |
|
| 1 |
Other Expenses |
4.230 |
41.790 |
| 2 |
|
|
|
| 3 |
|
|
|
| 4 |
|
|
|
| 5 |
|
|
|
| 6 |
|
|
|
| 7 |
|
|
|
| 8 |
|
|
|
| 9 |
|
|
|
| 10 |
|
|
|
| |
Total other expenses |
4.230 |
41.790 |
| |
Total expenses |
10.160 |
81.170 |
| 3 |
Total profit before exceptional items and tax |
56.780 |
13.940 |
| 4 |
Exceptional items |
0.000 |
0.000 |
| 5 |
Total profit before tax |
56.780 |
13.940 |
| 7 |
Tax expense |
|
| 8 |
Current tax |
3.610 |
3.610 |
| 9 |
Deferred tax |
-1.100 |
-1.100 |
| 10 |
Total tax expenses |
2.510 |
2.510 |
| 11 |
Net movement in regulatory deferral account balances related to profit or loss and the related deferred tax movement |
0.000 |
0.000 |
| 14 |
Net Profit Loss for the period from continuing operations |
54.270 |
11.430 |
| 15 |
Profit (loss) from discontinued operations before tax |
0.000 |
0.000 |
| 16 |
Tax expense of discontinued operations |
0.000 |
0.000 |
| 17 |
Net profit (loss) from discontinued operation after tax |
0.000 |
0.000 |
| 19 |
Share of profit (loss) of associates and joint ventures accounted for using equity method |
0.000 |
0.000 |
| 21 |
Total profit (loss) for period |
54.270 |
11.430 |
| 22 |
Other comprehensive income net of taxes |
0.260 |
0.260 |
| 23 |
Total Comprehensive Income for the period |
54.530 |
11.690 |
| 24 |
Total profit or loss, attributable to |
|
| |
Profit or loss, attributable to owners of parent |
|
|
| |
Total profit or loss, attributable to non-controlling interests |
|
|
| 25 |
Total Comprehensive income for the period attributable to |
|
| |
Comprehensive income for the period attributable to owners of parent |
0.000 |
0.000 |
| |
Total comprehensive income for the period attributable to owners of parent non-controlling interests |
0.000 |
0.000 |
| 26 |
Details of equity share capital |
|
| |
Paid-up equity share capital |
506.690 |
506.690 |
| |
Face value of equity share capital |
10.000 |
10.000 |
| 27 |
Details of debt securities |
|
| 28 |
Reserves excluding revaluation reserve |
|
0.000 |
| 29 |
Earnings per share |
|
| i |
Earnings per equity share for continuing operations |
|
| |
Basic earnings (loss) per share from continuing operations |
1.070 |
0.230 |
| |
Diluted earnings (loss) per share from continuing operations |
1.070 |
0.230 |
| ii |
Earnings per equity share for discontinued operations |
|
| |
Basic earnings (loss) per share from discontinued operations |
0.000 |
0.000 |
| |
Diluted earnings (loss) per share from discontinued operations |
0.000 |
0.000 |
| ii |
Earnings per equity share |
|
| |
Basic earnings (loss) per share from continuing and discontinued operations |
1.070 |
0.230 |
| |
Diluted earnings (loss) per share from continuing and discontinued operations |
1.070 |
0.230 |
| 30 |
Debt equity ratio |
|
|
| 31 |
Debt service coverage ratio |
|
|
| 32 |
Interest service coverage ratio |
|
|
| 33 |
Disclosure of notes on financial results |
|
|
|
| Statement of Asset and Liabilities |
| Particulars |
Current year ended (dd-mm-yyyy) |
| Date of start of reporting period |
01-04-2018 |
| Date of end of reporting period |
31-03-2019 |
| Whether results are audited or unaudited |
Audited |
| Nature of report standalone or consolidated |
Standalone |
| |
| |
Assets |
|
| 1 |
Non-current assets |
|
| |
Property, plant and equipment |
41.480 |
| |
Capital work-in-progress |
0.000 |
| |
Investment property |
0.000 |
| |
Goodwill |
0.000 |
| |
Other intangible assets |
0.000 |
| |
Intangible assets under development |
0.000 |
| |
Biological assets other than bearer plants |
0.000 |
| |
Investments accounted for using equity method |
0.000 |
| |
Non-current financial assets |
|
| |
Non-current investments |
29.150 |
| |
Trade receivables, non-current |
0.000 |
| |
Loans, non-current |
20.000 |
| |
Other non-current financial assets |
0.000 |
| |
Total non-current financial assets |
49.150 |
| |
Deferred tax assets (net) |
1.190 |
| |
Other non-current assets |
100.660 |
| |
Total non-current assets |
192.480 |
| 2 |
Current assets |
|
| |
Inventories |
0.000 |
| |
Current financial asset |
|
| |
Current investments |
0.000 |
| |
Trade receivables, current |
85.000 |
| |
Cash and cash equivalents |
75.700 |
| |
Bank balance other than cash and cash equivalents |
25.000 |
| |
Loans, current |
0.000 |
| |
Other current financial assets |
9.590 |
| |
Total current financial assets |
195.290 |
| |
Current tax assets (net) |
|
| |
Other current assets |
|
| |
Total current assets |
195.290 |
| 3 |
Non-current assets classified as held for sale |
0.000 |
| 4 |
Regulatory deferral account debit balances and related deferred tax Assets |
0.000 |
| |
Total assets |
387.770 |
| |
Equity and liabilities |
|
| 1 |
Equity |
|
| |
Equity attributable to owners of parent |
|
| |
Equity share capital |
506.690 |
| |
Other equity |
-214.840 |
| |
Total equity attributable to owners of parent |
291.850 |
| |
Non controlling interest |
|
| |
Total equity |
291.850 |
| 2 |
Liabilities |
|
| |
Non-current liabilities |
|
| |
Non-current financial liabilities |
|
| |
Borrowings, non-current |
25.150 |
| |
Trade payables, non-current |
0.000 |
| |
Other non-current financial liabilities |
0.000 |
| |
Total non-current financial liabilities |
25.150 |
| |
Provisions, non-current |
0.000 |
| |
Deferred tax liabilities (net) |
0.000 |
| |
Deferred government grants, Non-current |
0.000 |
| |
Other non-current liabilities |
0.000 |
| |
Total non-current liabilities |
25.150 |
| |
Current liabilities |
|
| |
Current financial liabilities |
|
| |
Borrowings, current |
58.900 |
| |
Trade payables, current |
0.000 |
| |
Other current financial liabilities |
7.460 |
| |
Total current financial liabilities |
66.360 |
| |
Other current liabilities |
4.410 |
| |
Provisions, current |
0.000 |
| |
Current tax liabilities (Net) |
0.000 |
| |
Deferred government grants, Current |
0.000 |
| |
Total current liabilities |
70.770 |
| 3 |
Liabilities directly associated with assets in disposal group classified as held for sale |
0.000 |
| 4 |
Regulatory deferral account credit balances and related deferred tax liability |
0.000 |
| |
Total liabilities |
95.920 |
| |
Total equity and liabilites |
387.770 |
| |
Disclosure of notes on assets and liabilities |
|
|
|
|
|
| |
| Format for Reporting Segmenet wise Revenue, Results and Capital Employed along with the company results |
| Particulars |
3 months/ 6 month ended (dd-mm-yyyy) |
Year to date figures for current period ended (dd-mm-yyyy) |
| Date of start of reporting period |
01-01-2019 |
01-04-2018 |
| Date of end of reporting period |
31-03-2019 |
31-03-2019 |
| Whether accounts are audited or unaudited |
|
|
| Nature of report standalone or consolidated |
Standalone |
Standalone |
| 1 |
Segment Revenue (Income) |
|
| |
(net sale/income from each segment should be disclosed) |
|
| 1 |
|
|
|
| 2 |
|
|
|
| 3 |
|
|
|
| 4 |
|
|
|
| 5 |
|
|
|
| 6 |
|
|
|
| 7 |
|
|
|
| 8 |
|
|
|
| 9 |
|
|
|
| 10 |
|
|
|
| 11 |
|
|
|
| 12 |
|
|
|
| 13 |
|
|
|
| 14 |
|
|
|
| 15 |
|
|
|
| |
Total Segment Revenue |
|
|
| |
Less: Inter segment revenue |
|
|
| |
Revenue from operations |
|
|
|
|
|
|
| 2 |
Segment Result |
|
| |
Profit (+) / Loss (-) before tax and interest from each segment |
|
| 1 |
|
|
|
| 2 |
|
|
|
| 3 |
|
|
|
| 4 |
|
|
|
| 5 |
|
|
|
| 6 |
|
|
|
| 7 |
|
|
|
| 8 |
|
|
|
| 9 |
|
|
|
| 10 |
|
|
|
| 11 |
|
|
|
| 12 |
|
|
|
| 13 |
|
|
|
| 14 |
|
|
|
| 15 |
|
|
|
| |
Total Profit before tax |
|
|
| |
i. Finance cost |
|
|
| |
ii. Other Unallocable Expenditure net off Unallocable income |
|
|
| |
Profit before tax |
|
|
|
|
|
|
| 3 |
(Segment Asset - Segment Liabilities) |
|
| |
Segment Asset |
|
| 1 |
|
|
|
| 2 |
|
|
|
| 3 |
|
|
|
| 4 |
|
|
|
| 5 |
|
|
|
| 6 |
|
|
|
| 7 |
|
|
|
| 8 |
|
|
|
| 9 |
|
|
|
| 10 |
|
|
|
| 11 |
|
|
|
| 12 |
|
|
|
| 13 |
|
|
|
| 14 |
|
|
|
| 15 |
|
|
|
| |
Total Segment Asset |
|
|
| |
Un-allocable Assets |
|
|
| |
Net Segment Asset |
|
|
|
|
|
|
| 4 |
Segment Liabilities |
|
| |
Segment Liabilities |
|
| 1 |
|
|
|
| 2 |
|
|
|
| 3 |
|
|
|
| 4 |
|
|
|
| 5 |
|
|
|
| 6 |
|
|
|
| 7 |
|
|
|
| 8 |
|
|
|
| 9 |
|
|
|
| 10 |
|
|
|
| 11 |
|
|
|
| 12 |
|
|
|
| 13 |
|
|
|
| 14 |
|
|
|
| 15 |
|
|
|
| |
Total Segment Liabilities |
|
|
| |
Un-allocable Liabilities |
|
|
| |
Net Segment Liabilities |
|
|
| |
Disclosure of notes on segments |
|
|
|
|
|
|
|
| Other Comprehensive Income |
| Particulars |
3 months/ 6 month ended (dd-mm-yyyy) |
Year to date figures for current period ended (dd-mm-yyyy) |
| A |
Date of start of reporting period |
01-01-2019 |
01-04-2018 |
| B |
Date of end of reporting period |
31-03-2019 |
31-03-2019 |
| C |
Whether results are audited or unaudited |
Audited |
Audited |
| D |
Nature of report standalone or consolidated |
Standalone |
Standalone |
| |
Other comprehensive income [Abstract] |
|
| 1 |
Amount of items that will not be reclassified to profit and loss |
|
| 1 |
net gain/loss on fair value of equity instruments |
0.260 |
0.260 |
| |
Total Amount of items that will not be reclassified to profit and loss |
0.260 |
0.260 |
| 2 |
Income tax relating to items that will not be reclassified to profit or loss |
0.000 |
0.000 |
| 3 |
Amount of items that will be reclassified to profit and loss |
|
| |
Total Amount of items that will be reclassified to profit and loss |
|
|
| 4 |
Income tax relating to items that will be reclassified to profit or loss |
0.000 |
0.000 |
| 5 |
Total Other comprehensive income |
0.260 |
0.260 |
|
| |
| General information about company |
| Scrip code |
531846 |
|
| NSE Symbol |
|
| MSEI Symbol |
|
| ISIN* |
INE884X01011 |
| Name of company |
TRINITY LEAGUE INDIA LTD. |
| Class of security |
Equity |
| Date of start of financial year |
01 |
04 |
2018 |
|
| Date of end of financial year |
31 |
03 |
2019 |
| Date of board meeting when results were approved |
02 |
02 |
2019 |
| Date on which prior intimation of the meeting for considering financial results was informed to the exchange |
25 |
01 |
2019 |
| Description of presentation currency |
INR |
|
|
|
| Level of rounding used in financial results |
Lakhs |
Reporting only in "Lakhs", "Millions", "Billions", "Crores" Allowed |
| Reporting Quarter |
Third quarter |
|
|
|
| Nature of report standalone or consolidated |
Standalone |
|
|
|
| Whether results are audited or unaudited |
Unaudited |
For Current Quarter Only |
| Segment Reporting |
Single segment |
|
| Description of single segment |
Business Auxillary Services |
| Start date and time of board meeting |
02-02-2019 |
13 |
00 |
HH:MM |
| End date and time of board meeting |
02-02-2019 |
04 |
30 |
HH:MM |
| Declaration of unmodified opinion or statement on impact of audit qualification |
Not applicable |
|
|
|
| Financial Results – Ind-AS |
| Particulars |
3 months/ 6 months ended (dd-mm-yyyy) |
Year to date figures for current period ended (dd-mm-yyyy) |
| A |
Date of start of reporting period |
01-10-2018 |
01-04-2018 |
| B |
Date of end of reporting period |
31-12-2018 |
31-12-2018 |
| C |
Whether results are audited or unaudited |
Unaudited |
Unaudited |
| D |
Nature of report standalone or consolidated |
Standalone |
Standalone |
| Part I |
Blue color marked fields are non-mandatory. For Consolidated Results, if the company has no figures for 3 months / 6 months ended, in such case zero shall be inserted in the said column. |
| 1 |
Income |
|
| |
Revenue from operations |
21.770 |
21.770 |
| |
Other income |
3.140 |
6.400 |
| |
Total income |
24.910 |
28.170 |
| 2 |
Expenses |
|
| (a) |
Cost of materials consumed |
0.000 |
0.000 |
| (b) |
Purchases of stock-in-trade |
0.000 |
0.000 |
| (c) |
Changes in inventories of finished goods, work-in-progress and stock-in-trade |
0.000 |
0.000 |
| (d) |
Employee benefit expense |
9.870 |
25.560 |
| (e) |
Finance costs |
0.920 |
2.000 |
| (f) |
Depreciation, depletion and amortisation expense |
2.180 |
5.890 |
| (f) |
Other Expenses |
|
| 1 |
Other Expenses |
14.270 |
37.560 |
| 2 |
|
|
|
| 3 |
|
|
|
| 4 |
|
|
|
| 5 |
|
|
|
| 6 |
|
|
|
| 7 |
|
|
|
| 8 |
|
|
|
| 9 |
|
|
|
| 10 |
|
|
|
| |
Total other expenses |
14.270 |
37.560 |
| |
Total expenses |
27.240 |
71.010 |
| 3 |
Total profit before exceptional items and tax |
-2.330 |
-42.840 |
| 4 |
Exceptional items |
0.000 |
0.000 |
| 5 |
Total profit before tax |
-2.330 |
-42.840 |
| 7 |
Tax expense |
|
| 8 |
Current tax |
0.000 |
0.000 |
| 9 |
Deferred tax |
0.000 |
0.000 |
| 10 |
Total tax expenses |
0.000 |
0.000 |
| 11 |
Net movement in regulatory deferral account balances related to profit or loss and the related deferred tax movement |
0.000 |
0.000 |
| 14 |
Net Profit Loss for the period from continuing operations |
-2.330 |
-42.840 |
| 15 |
Profit (loss) from discontinued operations before tax |
0.000 |
0.000 |
| 16 |
Tax expense of discontinued operations |
0.000 |
0.000 |
| 17 |
Net profit (loss) from discontinued operation after tax |
0.000 |
0.000 |
| 19 |
Share of profit (loss) of associates and joint ventures accounted for using equity method |
0.000 |
0.000 |
| 21 |
Total profit (loss) for period |
-2.330 |
-42.840 |
| 22 |
Other comprehensive income net of taxes |
0.000 |
0.000 |
| 23 |
Total Comprehensive Income for the period |
-2.330 |
-42.840 |
| 24 |
Total profit or loss, attributable to |
|
| |
Profit or loss, attributable to owners of parent |
|
|
| |
Total profit or loss, attributable to non-controlling interests |
|
|
| 25 |
Total Comprehensive income for the period attributable to |
|
| |
Comprehensive income for the period attributable to owners of parent |
0.000 |
0.000 |
| |
Total comprehensive income for the period attributable to owners of parent non-controlling interests |
0.000 |
0.000 |
| 26 |
Details of equity share capital |
|
| |
Paid-up equity share capital |
506.690 |
506.690 |
| |
Face value of equity share capital |
10.000 |
10.000 |
| 27 |
Details of debt securities |
|
| 28 |
Reserves excluding revaluation reserve |
|
|
| 29 |
Earnings per share |
|
| i |
Earnings per equity share for continuing operations |
|
| |
Basic earnings (loss) per share from continuing operations |
-0.050 |
-0.850 |
| |
Diluted earnings (loss) per share from continuing operations |
-0.050 |
-0.850 |
| ii |
Earnings per equity share for discontinued operations |
|
| |
Basic earnings (loss) per share from discontinued operations |
0.000 |
0.000 |
| |
Diluted earnings (loss) per share from discontinued operations |
0.000 |
0.000 |
| ii |
Earnings per equity share |
|
| |
Basic earnings (loss) per share from continuing and discontinued operations |
-0.050 |
-0.850 |
| |
Diluted earnings (loss) per share from continuing and discontinued operations |
-0.050 |
-0.850 |
| 30 |
Debt equity ratio |
|
|
| 31 |
Debt service coverage ratio |
|
|
| 32 |
Interest service coverage ratio |
|
|
| 33 |
Disclosure of notes on financial results |
|
|
|
|
| Format for Reporting Segmenet wise Revenue, Results and Capital Employed along with the company results |
| Particulars |
3 months/ 6 month ended (dd-mm-yyyy) |
Year to date figures for current period ended (dd-mm-yyyy) |
| Date of start of reporting period |
01-10-2018 |
01-04-2018 |
| Date of end of reporting period |
31-12-2018 |
31-12-2018 |
| Whether accounts are audited or unaudited |
|
|
| Nature of report standalone or consolidated |
Standalone |
Standalone |
| 1 |
Segment Revenue (Income) |
|
| |
(net sale/income from each segment should be disclosed) |
|
| 1 |
|
|
|
| 2 |
|
|
|
| 3 |
|
|
|
| 4 |
|
|
|
| 5 |
|
|
|
| 6 |
|
|
|
| 7 |
|
|
|
| 8 |
|
|
|
| 9 |
|
|
|
| 10 |
|
|
|
| 11 |
|
|
|
| 12 |
|
|
|
| 13 |
|
|
|
| 14 |
|
|
|
| 15 |
|
|
|
| |
Total Segment Revenue |
|
|
| |
Less: Inter segment revenue |
|
|
| |
Revenue from operations |
|
|
|
|
|
|
| 2 |
Segment Result |
|
| |
Profit (+) / Loss (-) before tax and interest from each segment |
|
| 1 |
|
|
|
| 2 |
|
|
|
| 3 |
|
|
|
| 4 |
|
|
|
| 5 |
|
|
|
| 6 |
|
|
|
| 7 |
|
|
|
| 8 |
|
|
|
| 9 |
|
|
|
| 10 |
|
|
|
| 11 |
|
|
|
| 12 |
|
|
|
| 13 |
|
|
|
| 14 |
|
|
|
| 15 |
|
|
|
| |
Total Profit before tax |
|
|
| |
i. Finance cost |
|
|
| |
ii. Other Unallocable Expenditure net off Unallocable income |
|
|
| |
Profit before tax |
|
|
|
|
|
|
| 3 |
(Segment Asset - Segment Liabilities) |
|
| |
Segment Asset |
|
| 1 |
|
|
|
| 2 |
|
|
|
| 3 |
|
|
|
| 4 |
|
|
|
| 5 |
|
|
|
| 6 |
|
|
|
| 7 |
|
|
|
| 8 |
|
|
|
| 9 |
|
|
|
| 10 |
|
|
|
| 11 |
|
|
|
| 12 |
|
|
|
| 13 |
|
|
|
| 14 |
|
|
|
| 15 |
|
|
|
| |
Total Segment Asset |
|
|
| |
Un-allocable Assets |
|
|
| |
Net Segment Asset |
|
|
|
|
|
|
| 4 |
Segment Liabilities |
|
| |
Segment Liabilities |
|
| 1 |
|
|
|
| 2 |
|
|
|
| 3 |
|
|
|
| 4 |
|
|
|
| 5 |
|
|
|
| 6 |
|
|
|
| 7 |
|
|
|
| 8 |
|
|
|
| 9 |
|
|
|
| 10 |
|
|
|
| 11 |
|
|
|
| 12 |
|
|
|
| 13 |
|
|
|
| 14 |
|
|
|
| 15 |
|
|
|
| |
Total Segment Liabilities |
|
|
| |
Un-allocable Liabilities |
|
|
| |
Net Segment Liabilities |
|
|
| |
Disclosure of notes on segments |
|
|
|
|
|
|
|
| Other Comprehensive Income |
| Particulars |
3 months/ 6 month ended (dd-mm-yyyy) |
Year to date figures for current period ended (dd-mm-yyyy) |
| A |
Date of start of reporting period |
01-10-2018 |
01-04-2018 |
| B |
Date of end of reporting period |
31-12-2018 |
31-12-2018 |
| C |
Whether results are audited or unaudited |
Unaudited |
Unaudited |
| D |
Nature of report standalone or consolidated |
Standalone |
Standalone |
| |
Other comprehensive income [Abstract] |
|
| 1 |
Amount of items that will not be reclassified to profit and loss |
|
| |
Total Amount of items that will not be reclassified to profit and loss |
|
|
| 2 |
Income tax relating to items that will not be reclassified to profit or loss |
|
|
| 3 |
Amount of items that will be reclassified to profit and loss |
|
| |
Total Amount of items that will be reclassified to profit and loss |
|
|
| 4 |
Income tax relating to items that will be reclassified to profit or loss |
|
|
| 5 |
Total Other comprehensive income |
|
|
|
|
| General information about company |
| Scrip code |
531846 |
|
| NSE Symbol |
|
| MSEI Symbol |
|
| ISIN* |
INE884X01011 |
| Name of company |
TRINITY LEAGUE INDIA LTD. |
| Class of security |
Equity |
| Date of start of financial year |
01 |
04 |
2018 |
|
| Date of end of financial year |
31 |
03 |
2019 |
| Date of board meeting when results were approved |
05 |
11 |
2018 |
| Date on which prior intimation of the meeting for considering financial results was informed to the exchange |
26 |
10 |
2018 |
| Description of presentation currency |
INR |
|
| Level of rounding used in financial results |
Lakhs |
| Reporting Quarter |
Half yearly |
| Nature of report standalone or consolidated |
Standalone |
| Whether results are audited or unaudited |
Unaudited |
For Current Quarter Only |
| Segment Reporting |
Single segment |
|
| Description of single segment |
Business Auxillary Services |
| Start date and time of board meeting |
05-11-2018 |
10 |
00 |
HH:MM |
| End date and time of board meeting |
05-11-2018 |
05 |
30 |
HH:MM |
| Declaration of unmodified opinion or statement on impact of audit qualification |
Not applicable |
|
|
| Financial Results – Ind-AS |
| Particulars |
3 months/ 6 months ended (dd-mm-yyyy) |
Year to date figures for current period ended (dd-mm-yyyy) |
| A |
Date of start of reporting period |
01-07-2018 |
01-04-2018 |
| B |
Date of end of reporting period |
30-09-2018 |
30-09-2018 |
| C |
Whether results are audited or unaudited |
Unaudited |
Unaudited |
| D |
Nature of report standalone or consolidated |
Standalone |
Standalone |
| Part I |
Blue color marked fields are non-mandatory. For Consolidated Results, if the company has no figures for 3 months / 6 months ended, in such case zero shall be inserted in the said column. |
| 1 |
Income |
|
| |
Revenue from operations |
0.000 |
0.000 |
| |
Other income |
1.510 |
3.260 |
| |
Total income |
1.510 |
3.260 |
| 2 |
Expenses |
|
| (a) |
Cost of materials consumed |
0.000 |
0.000 |
| (b) |
Purchases of stock-in-trade |
0.000 |
0.000 |
| (c) |
Changes in inventories of finished goods, work-in-progress and stock-in-trade |
0.000 |
0.000 |
| (d) |
Employee benefit expense |
8.500 |
15.690 |
| (e) |
Finance costs |
0.770 |
1.080 |
| (f) |
Depreciation, depletion and amortisation expense |
2.170 |
3.710 |
| (f) |
Other Expenses |
|
| 1 |
Other Expenses |
11.210 |
23.290 |
| 2 |
|
|
|
| 3 |
|
|
|
| 4 |
|
|
|
| 5 |
|
|
|
| 6 |
|
|
|
| 7 |
|
|
|
| 8 |
|
|
|
| 9 |
|
|
|
| 10 |
|
|
|
| |
Total other expenses |
11.210 |
23.290 |
| |
Total expenses |
22.650 |
43.770 |
| 3 |
Total profit before exceptional items and tax |
-21.140 |
-40.510 |
| 4 |
Exceptional items |
0.000 |
0.000 |
| 5 |
Total profit before tax |
-21.140 |
-40.510 |
| 7 |
Tax expense |
|
| 8 |
Current tax |
0.000 |
0.000 |
| 9 |
Deferred tax |
0.000 |
0.000 |
| 10 |
Total tax expenses |
0.000 |
0.000 |
| 11 |
Net movement in regulatory deferral account balances related to profit or loss and the related deferred tax movement |
0.000 |
0.000 |
| 14 |
Net Profit Loss for the period from continuing operations |
-21.140 |
-40.510 |
| 15 |
Profit (loss) from discontinued operations before tax |
0.000 |
0.000 |
| 16 |
Tax expense of discontinued operations |
0.000 |
0.000 |
| 17 |
Net profit (loss) from discontinued operation after tax |
0.000 |
0.000 |
| 19 |
Share of profit (loss) of associates and joint ventures accounted for using equity method |
0.000 |
0.000 |
| 21 |
Total profit (loss) for period |
-21.140 |
-40.510 |
| 22 |
Other comprehensive income net of taxes |
0.000 |
0.000 |
| 23 |
Total Comprehensive Income for the period |
-21.140 |
-40.510 |
| 24 |
Total profit or loss, attributable to |
|
| |
Profit or loss, attributable to owners of parent |
|
|
| |
Total profit or loss, attributable to non-controlling interests |
|
|
| 25 |
Total Comprehensive income for the period attributable to |
|
| |
Comprehensive income for the period attributable to owners of parent |
0.000 |
0.000 |
| |
Total comprehensive income for the period attributable to owners of parent non-controlling interests |
0.000 |
0.000 |
| 26 |
Details of equity share capital |
|
| |
Paid-up equity share capital |
506.690 |
506.690 |
| |
Face value of equity share capital |
10.000 |
10.000 |
| 27 |
Details of debt securities |
|
| 28 |
Reserves excluding revaluation reserve |
|
|
| 29 |
Earnings per share |
|
| i |
Earnings per equity share for continuing operations |
|
| |
Basic earnings (loss) per share from continuing operations |
-0.420 |
-0.800 |
| |
Diluted earnings (loss) per share from continuing operations |
-0.420 |
-0.800 |
| ii |
Earnings per equity share for discontinued operations |
|
| |
Basic earnings (loss) per share from discontinued operations |
0.000 |
0.000 |
| |
Diluted earnings (loss) per share from discontinued operations |
0.000 |
0.000 |
| ii |
Earnings per equity share |
|
| |
Basic earnings (loss) per share from continuing and discontinued operations |
-0.420 |
-0.800 |
| |
Diluted earnings (loss) per share from continuing and discontinued operations |
-0.420 |
-0.800 |
| 30 |
Debt equity ratio |
|
|
| 31 |
Debt service coverage ratio |
|
|
| 32 |
Interest service coverage ratio |
|
|
| 33 |
Disclosure of notes on financial results |
|
|
|
|
|
|
|
| Statement of Asset and Liabilities |
| Particulars |
Half year ended (dd-mm-yyyy) |
|
| Date of start of reporting period |
01-04-2018 |
| Date of end of reporting period |
30-09-2018 |
| Whether results are audited or unaudited |
Unaudited |
| Nature of report standalone or consolidated |
Standalone |
| |
| |
Assets |
|
| 1 |
Non-current assets |
|
| |
Property, plant and equipment |
45.830 |
| |
Capital work-in-progress |
0.000 |
| |
Investment property |
0.000 |
| |
Goodwill |
0.000 |
| |
Other intangible assets |
0.000 |
| |
Intangible assets under development |
0.000 |
| |
Biological assets other than bearer plants |
0.000 |
| |
Investments accounted for using equity method |
0.000 |
| |
Non-current financial assets |
|
| |
Non-current investments |
28.890 |
| |
Trade receivables, non-current |
0.000 |
| |
Loans, non-current |
20.000 |
| |
Other non-current financial assets |
0.000 |
| |
Total non-current financial assets |
48.890 |
| |
Deferred tax assets (net) |
0.090 |
| |
Other non-current assets |
1.470 |
| |
Total non-current assets |
96.280 |
| 2 |
Current assets |
|
| |
Inventories |
0.000 |
| |
Current financial asset |
|
| |
Current investments |
0.000 |
| |
Trade receivables, current |
127.420 |
| |
Cash and cash equivalents |
2.010 |
| |
Bank balance other than cash and cash equivalents |
44.100 |
| |
Loans, current |
0.000 |
| |
Other current financial assets |
8.110 |
| |
Total current financial assets |
181.640 |
| |
Current tax assets (net) |
0.000 |
| |
Other current assets |
0.000 |
| |
Total current assets |
181.640 |
| 3 |
Non-current assets classified as held for sale |
0.000 |
| 4 |
Regulatory deferral account debit balances and related deferred tax Assets |
0.000 |
| |
Total assets |
277.920 |
| |
Equity and liabilities |
|
| 1 |
Equity |
|
| |
Equity attributable to owners of parent |
|
| |
Equity share capital |
506.690 |
| |
Other equity |
-267.040 |
| |
Total equity attributable to owners of parent |
239.650 |
| |
Non controlling interest |
|
| |
Total equity |
239.650 |
| 2 |
Liabilities |
|
| |
Non-current liabilities |
|
| |
Non-current financial liabilities |
|
| |
Borrowings, non-current |
28.560 |
| |
Trade payables, non-current |
0.000 |
| |
Other non-current financial liabilities |
0.000 |
| |
Total non-current financial liabilities |
28.560 |
| |
Provisions, non-current |
0.000 |
| |
Deferred tax liabilities (net) |
0.000 |
| |
Deferred government grants, Non-current |
0.000 |
| |
Other non-current liabilities |
0.000 |
| |
Total non-current liabilities |
28.560 |
| |
Current liabilities |
|
| |
Current financial liabilities |
|
| |
Borrowings, current |
0.000 |
| |
Trade payables, current |
0.100 |
| |
Other current financial liabilities |
6.400 |
| |
Total current financial liabilities |
6.500 |
| |
Other current liabilities |
3.210 |
| |
Provisions, current |
0.000 |
| |
Current tax liabilities (Net) |
0.000 |
| |
Deferred government grants, Current |
0.000 |
| |
Total current liabilities |
9.710 |
| 3 |
Liabilities directly associated with assets in disposal group classified as held for sale |
0.000 |
| 4 |
Regulatory deferral account credit balances and related deferred tax liability |
0.000 |
| |
Total liabilities |
38.270 |
| |
Total equity and liabilites |
277.920 |
| |
Disclosure of notes on assets and liabilities |
|
|
| Format for Reporting Segmenet wise Revenue, Results and Capital Employed along with the company results |
| Particulars |
3 months/ 6 month ended (dd-mm-yyyy) |
Year to date figures for current period ended (dd-mm-yyyy) |
|
| Date of start of reporting period |
01-07-2018 |
01-04-2018 |
| Date of end of reporting period |
30-09-2018 |
30-09-2018 |
| Whether accounts are audited or unaudited |
|
|
| Nature of report standalone or consolidated |
Standalone |
Standalone |
| 1 |
Segment Revenue (Income) |
|
| |
(net sale/income from each segment should be disclosed) |
|
| 1 |
|
|
|
| 2 |
|
|
|
| 3 |
|
|
|
| 4 |
|
|
|
| 5 |
|
|
|
| 6 |
|
|
|
| 7 |
|
|
|
| 8 |
|
|
|
| 9 |
|
|
|
| 10 |
|
|
|
| 11 |
|
|
|
| 12 |
|
|
|
| 13 |
|
|
|
| 14 |
|
|
|
| 15 |
|
|
|
| |
Total Segment Revenue |
|
|
| |
Less: Inter segment revenue |
|
|
| |
Revenue from operations |
|
|
|
|
|
|
| 2 |
Segment Result |
|
| |
Profit (+) / Loss (-) before tax and interest from each segment |
|
| 1 |
|
|
|
| 2 |
|
|
|
| 3 |
|
|
|
| 4 |
|
|
|
| 5 |
|
|
|
| 6 |
|
|
|
| 7 |
|
|
|
| 8 |
|
|
|
| 9 |
|
|
|
| 10 |
|
|
|
| 11 |
|
|
|
| 12 |
|
|
|
| 13 |
|
|
|
| 14 |
|
|
|
| 15 |
|
|
|
| |
Total Profit before tax |
|
|
| |
i. Finance cost |
|
|
| |
ii. Other Unallocable Expenditure net off Unallocable income |
|
|
| |
Profit before tax |
|
|
|
|
|
|
| 3 |
(Segment Asset - Segment Liabilities) |
|
| |
Segment Asset |
|
| 1 |
|
|
|
| 2 |
|
|
|
| 3 |
|
|
|
| 4 |
|
|
|
| 5 |
|
|
|
| 6 |
|
|
|
| 7 |
|
|
|
| 8 |
|
|
|
| 9 |
|
|
|
| 10 |
|
|
|
| 11 |
|
|
|
| 12 |
|
|
|
| 13 |
|
|
|
| 14 |
|
|
|
| 15 |
|
|
|
| |
Total Segment Asset |
|
|
| |
Un-allocable Assets |
|
|
| |
Net Segment Asset |
|
|
|
|
|
|
| 4 |
Segment Liabilities |
|
| |
Segment Liabilities |
|
| 1 |
|
|
|
| 2 |
|
|
|
| 3 |
|
|
|
| 4 |
|
|
|
| 5 |
|
|
|
| 6 |
|
|
|
| 7 |
|
|
|
| 8 |
|
|
|
| 9 |
|
|
|
| 10 |
|
|
|
| 11 |
|
|
|
| 12 |
|
|
|
| 13 |
|
|
|
| 14 |
|
|
|
| 15 |
|
|
|
| |
Total Segment Liabilities |
|
|
| |
Un-allocable Liabilities |
|
|
| |
Net Segment Liabilities |
|
|
| |
Disclosure of notes on segments |
|
|
|
| Other Comprehensive Income |
| Particulars |
3 months/ 6 month ended (dd-mm-yyyy) |
Year to date figures for current period ended (dd-mm-yyyy) |
| A |
Date of start of reporting period |
01-07-2018 |
01-04-2018 |
| B |
Date of end of reporting period |
30-09-2018 |
30-09-2018 |
| C |
Whether results are audited or unaudited |
Unaudited |
Unaudited |
| D |
Nature of report standalone or consolidated |
Standalone |
Standalone |
| |
Other comprehensive income [Abstract] |
|
| 1 |
Amount of items that will not be reclassified to profit and loss |
|
| |
Total Amount of items that will not be reclassified to profit and loss |
|
|
| 2 |
Income tax relating to items that will not be reclassified to profit or loss |
0.000 |
0.000 |
| 3 |
Amount of items that will be reclassified to profit and loss |
|
| |
Total Amount of items that will be reclassified to profit and loss |
|
|
| 4 |
Income tax relating to items that will be reclassified to profit or loss |
0.000 |
0.000 |
| 5 |
Total Other comprehensive income |
0.000 |
0.000 |
|
| |
| General information about company |
| Scrip code |
531846 |
|
| NSE Symbol |
|
| MSEI Symbol |
|
| ISIN* |
INE884X01011 |
| Name of company |
TRINITY LEAGUE INDIA LTD. |
| Class of security |
Equity |
| Date of start of financial year |
01 |
04 |
2018 |
|
| Date of end of financial year |
31 |
03 |
2019 |
| Date of board meeting when results were approved |
27 |
07 |
2018 |
| Date on which prior intimation of the meeting for considering financial results was informed to the exchange |
19 |
07 |
2018 |
| Description of presentation currency |
INR |
|
| Level of rounding used in financial results |
Lakhs |
| Reporting Quarter |
First quarter |
| Nature of report standalone or consolidated |
Standalone |
| Whether results are audited or unaudited |
Unaudited |
For Current Quarter Only |
| Segment Reporting |
Single segment |
|
| Description of single segment |
Business Auxillary Services |
| Start time of board meeting |
27-07-2018 |
14 |
00 |
HH:MM |
| End time of board meeting |
27-07-2018 |
16 |
00 |
HH:MM |
| Declaration of unmodified opinion or statement on impact of audit qualification |
Not applicable |
|
|
| |
| Financial Results – Ind-AS |
| Particulars |
3 months/ 6 months ended (dd-mm-yyyy) |
Year to date figures for current period ended (dd-mm-yyyy) |
| A |
Date of start of reporting period |
01-04-2018 |
01-04-2018 |
| B |
Date of end of reporting period |
30-06-2018 |
30-06-2018 |
| C |
Whether results are audited or unaudited |
Unaudited |
Unaudited |
| D |
Nature of report standalone or consolidated |
Standalone |
Standalone |
| Part I |
Blue color marked fields are non-mandatory. For Consolidated Results, if the company has no figures for 3 months / 6 months ended, in such case zero shall be inserted in the said column. |
| 1 |
Income |
|
| |
Revenue from operations |
0.000 |
0.000 |
| |
Other income |
1.750 |
1.750 |
| |
Total income |
1.750 |
1.750 |
| 2 |
Expenses |
|
| (a) |
Cost of materials consumed |
0.000 |
0.000 |
| (b) |
Purchases of stock-in-trade |
0.000 |
0.000 |
| (c) |
Changes in inventories of finished goods, work-in-progress and stock-in-trade |
0.000 |
0.000 |
| (d) |
Employee benefit expense |
7.190 |
7.190 |
| (e) |
Finance costs |
1.540 |
1.540 |
| (f) |
Depreciation, depletion and amortisation expense |
1.540 |
1.540 |
| (f) |
Other Expenses |
|
| 1 |
Other Expenses |
12.090 |
12.090 |
| 2 |
|
|
|
| 3 |
|
|
|
| 4 |
|
|
|
| 5 |
|
|
|
| 6 |
|
|
|
| 7 |
|
|
|
| 8 |
|
|
|
| 9 |
|
|
|
| 10 |
|
|
|
| |
Total other expenses |
12.090 |
12.090 |
| |
Total expenses |
22.360 |
22.360 |
| 3 |
Total profit before exceptional items and tax |
-20.610 |
-20.610 |
| 4 |
Exceptional items |
0.000 |
0.000 |
| 5 |
Total profit before tax |
-20.610 |
-20.610 |
| 7 |
Tax expense |
|
| 8 |
Current tax |
0.000 |
0.000 |
| 9 |
Deferred tax |
0.000 |
0.000 |
| 10 |
Total tax expenses |
0.000 |
0.000 |
| 11 |
Net movement in regulatory deferral account balances related to profit or loss and the related deferred tax movement |
0.000 |
0.000 |
| 14 |
Net Profit Loss for the period from continuing operations |
-20.610 |
-20.610 |
| 15 |
Profit (loss) from discontinued operations before tax |
0.000 |
0.000 |
| 16 |
Tax expense of discontinued operations |
0.000 |
0.000 |
| 17 |
Net profit (loss) from discontinued operation after tax |
0.000 |
0.000 |
| 19 |
Share of profit (loss) of associates and joint ventures accounted for using equity method |
0.000 |
0.000 |
| 21 |
Total profit (loss) for period |
-20.610 |
-20.610 |
| 22 |
Other comprehensive income net of taxes |
0.000 |
0.000 |
| 23 |
Total Comprehensive Income for the period |
-20.610 |
-20.610 |
| 24 |
Total profit or loss, attributable to |
|
| |
Profit or loss, attributable to owners of parent |
|
|
| |
Total profit or loss, attributable to non-controlling interests |
|
|
| 25 |
Total Comprehensive income for the period attributable to |
|
| |
Comprehensive income for the period attributable to owners of parent |
0.000 |
0.000 |
| |
Total comprehensive income for the period attributable to owners of parent non-controlling interests |
0.000 |
0.000 |
| 26 |
Details of equity share capital |
|
| |
Paid-up equity share capital |
506.690 |
506.690 |
| |
Face value of equity share capital |
10.000 |
10.000 |
| 27 |
Details of debt securities |
|
| 28 |
Reserves excluding revaluation reserve |
|
|
| 29 |
Earnings per share |
|
| i |
Earnings per equity share for continuing operations |
|
| |
Basic earnings (loss) per share from continuing operations |
-0.380 |
-0.380 |
| |
Diluted earnings (loss) per share from continuing operations |
-0.380 |
-0.380 |
| ii |
Earnings per equity share for discontinued operations |
|
| |
Basic earnings (loss) per share from discontinued operations |
0.000 |
0.000 |
| |
Diluted earnings (loss) per share from discontinued operations |
0.000 |
0.000 |
| ii |
Earnings per equity share |
|
| |
Basic earnings (loss) per share from continuing and discontinued operations |
-0.380 |
-0.380 |
| |
Diluted earnings (loss) per share from continuing and discontinued operations |
-0.380 |
-0.380 |
| 30 |
Debt equity ratio |
|
|
| 31 |
Debt service coverage ratio |
|
|
| 32 |
Interest service coverage ratio |
|
|
| 33 |
Disclosure of notes on financial results |
|
|
|
|
|
|
|
| |
| Format for Reporting Segmenet wise Revenue, Results and Capital Employed along with the company results |
| Particulars |
3 months/ 6 month ended (dd-mm-yyyy) |
Year to date figures for current period ended (dd-mm-yyyy) |
| Date of start of reporting period |
01-04-2018 |
01-04-2018 |
| Date of end of reporting period |
30-06-2018 |
30-06-2018 |
| Whether accounts are audited or unaudited |
|
|
| Nature of report standalone or consolidated |
Standalone |
Standalone |
| 1 |
Segment Revenue (Income) |
|
| |
(net sale/income from each segment should be disclosed) |
|
| 1 |
|
|
|
| 2 |
|
|
|
| 3 |
|
|
|
| 4 |
|
|
|
| 5 |
|
|
|
| 6 |
|
|
|
| 7 |
|
|
|
| 8 |
|
|
|
| 9 |
|
|
|
| 10 |
|
|
|
| 11 |
|
|
|
| 12 |
|
|
|
| 13 |
|
|
|
| 14 |
|
|
|
| 15 |
|
|
|
| |
Total Segment Revenue |
|
|
| |
Less: Inter segment revenue |
|
|
| |
Revenue from operations |
|
|
|
|
|
|
| 2 |
Segment Result |
|
| |
Profit (+) / Loss (-) before tax and interest from each segment |
|
| 1 |
|
|
|
| 2 |
|
|
|
| 3 |
|
|
|
| 4 |
|
|
|
| 5 |
|
|
|
| 6 |
|
|
|
| 7 |
|
|
|
| 8 |
|
|
|
| 9 |
|
|
|
| 10 |
|
|
|
| 11 |
|
|
|
| 12 |
|
|
|
| 13 |
|
|
|
| 14 |
|
|
|
| 15 |
|
|
|
| |
Total Profit before tax |
|
|
| |
i. Finance cost |
|
|
| |
ii. Other Unallocable Expenditure net off Unallocable income |
|
|
| |
Profit before tax |
|
|
|
|
|
|
| 3 |
(Segment Asset - Segment Liabilities) |
|
| |
Segment Asset |
|
| 1 |
|
|
|
| 2 |
|
|
|
| 3 |
|
|
|
| 4 |
|
|
|
| 5 |
|
|
|
| 6 |
|
|
|
| 7 |
|
|
|
| 8 |
|
|
|
| 9 |
|
|
|
| 10 |
|
|
|
| 11 |
|
|
|
| 12 |
|
|
|
| 13 |
|
|
|
| 14 |
|
|
|
| 15 |
|
|
|
| |
Total Segment Asset |
|
|
| |
Un-allocable Assets |
|
|
| |
Net Segment Asset |
|
|
|
|
|
|
| 4 |
Segment Liabilities |
|
| |
Segment Liabilities |
|
| 1 |
|
|
|
| 2 |
|
|
|
| 3 |
|
|
|
| 4 |
|
|
|
| 5 |
|
|
|
| 6 |
|
|
|
| 7 |
|
|
|
| 8 |
|
|
|
| 9 |
|
|
|
| 10 |
|
|
|
| 11 |
|
|
|
| 12 |
|
|
|
| 13 |
|
|
|
| 14 |
|
|
|
| 15 |
|
|
|
| |
Total Segment Liabilities |
|
|
| |
Un-allocable Liabilities |
|
|
| |
Net Segment Liabilities |
|
|
| |
Disclosure of notes on segments |
|
|
|
|
|
|
|
| |
| |
| |
TRINITY LEAGUE INDIA LIMITED
CIN : L74999DL1988PLC031953
Regd. Office : A-23, Mandakini Enclave, Alaknanda, New Delhi-110019
Email ID for Investors : trinityleague@trinitygroup.ind.in |
| Statement of Audited Financial Results for the Quarter and Year ended March 31, 2018 |
|
|
|
| Sr. No. |
Particulars |
Quarter Ended 31.03.2018 |
Quarter Ended 31.12.2017 |
Quarter Ended 31.03.2017 |
Year Ended 31.03.2018 |
Year Ended 31.03.2017 |
| |
|
Audited |
Un audited |
Audited |
Audited |
Audited |
| 1 |
Income |
|
|
|
|
|
| |
(a) Revenue from operations |
80.75 |
20.00 |
14.70 |
107.25 |
14.70 |
| |
b) Other Income |
2.41 |
0.75 |
6.00 |
5.91 |
6.05 |
| |
Total Income (a+b) |
83.16 |
20.75 |
20.70 |
113.16 |
20.75 |
| 2 |
Expenses |
|
|
|
|
|
| |
a) Employee Cost |
3.28 |
2.94 |
3.37 |
40.26 |
13.44 |
| |
b) Deprecation and Amortisation expense |
1.17 |
0.73 |
0.89 |
3.37 |
3.73 |
| |
c) Other Expenses |
3.59 |
1.69 |
0.73 |
9.57 |
12.13 |
| |
Total expenses |
8.05 |
5.36 |
4.99 |
53.21 |
29.30 |
| 3 |
Profit / (Loss) before exceptional items & tax (1-2) |
75.11 |
15.39 |
15.71 |
59.95 |
(8.55) |
| 4 |
Exceptional items |
- |
- |
- |
- |
- |
| 5 |
Profit / (Loss) before tax (3-4) |
75.11 |
15.39 |
15.71 |
59.95 |
(8.55) |
| 6 |
Tax expense : |
|
|
|
|
|
| |
Current Tax |
11.43 |
- |
- |
11.43 |
- |
| |
Deffered Tax |
0.39 |
- |
(0.48) |
0.39 |
(0.48) |
| 7 |
Net Profit / (Loss) for the period (5-6) |
63.29 |
15.39 |
16.19 |
48.13 |
(8.07) |
| 8 |
Other comprehensive Income |
|
|
|
|
|
| |
(i) Items that will not be reclassified to profit or loss (Net of Taxes) |
|
- |
|
|
|
| |
Net Gain/(loss) on Fair Value of Equity Instuments |
(5.32) |
|
15.91 |
(5.32) |
15.91 |
| |
(ii) Items that will be reclassified to profit or loss (Net of Taxes) |
- |
- |
- |
- |
- |
| 9 |
Total Comprehensive income for the period (7+8) |
57.97 |
15.39 |
32.10 |
42.81 |
7.84 |
| 10 |
Paid-up equity share capital (Face Value of Rs.10/- each) |
506.69 |
506.69 |
506.69 |
506.69 |
506.69 |
| 11 |
Other Equity |
- |
- |
- |
(226.53) |
(269.34) |
| 12 |
Earnings Per Share (of Rs 10/- each) (not annualized): |
|
|
|
|
|
| |
(a) Basic |
1.25 |
0.30 |
0.32 |
0.95 |
(0.16) |
| |
(b) Diluted |
1.25 |
0.30 |
0.32 |
0.95 |
(0.16) |
| *Also Refer accompanying notes to the financial results |
|
|
|
|
|
| NOTES: |
|
|
|
|
|
|
| 1 |
The statement of Audited results have been reviewed by the Audit Committee of the Board of Directors in the meeting held on 16thMay 2018 approved by the Board of Directors in the meeting held on the same day. |
| 2 |
The statutory auditors of the company have audited the financial results for the quarter and year ended 31stMarch 2018 as required under Regulation 33 of the Securities and Exchange Board of India (Listing Obligations and Disclosure Requirements) Regulations, 2015. |
| 3 |
The company adopted Ind AS from 1st April 2017 and accordingly the financial results are prepared in accordance with Indian Accounting Standards (IndAS) notified under Companies (Indian Accounting Standards) Rules 2015. The comparative figures for the quarter and year ended 31stMarch 2017 have been recasted. |
| 4 |
Reconciliation of results between previously reported under IGAAP and Ind AS for the quarter and year ended 31.03.2017 are presented as under. |
| S. No. |
Particulars |
Quarter Ended 31.03.2017 |
Year Ended 31.03.2017 |
|
|
|
| 1 |
Net Profit as per IGAAP (After Tax) (A) |
16.19 |
-8.07 |
|
|
|
| 2 |
Net Profit as per Ind AS (After Tax) (A) |
16.19 |
-8.07 |
|
|
|
| 3 |
Other Comprehensive income for the period under Ind AS (B) |
15.91 |
15.91 |
|
|
|
| 4 |
Total Comprehensive income for the period under Ind AS (c) = (A+B) |
32.1 |
7.84 |
|
|
|
| 5 |
The Reconciliation of equity reported in accordance with IGAAP to equity in accordance with Ind AS is given below: |
| S. No. |
Particulars |
As on 31.03.2017 |
As on 01.04.2016 |
|
|
|
| 1 |
Equity reported under IGAAP |
236.67 |
225.61 |
|
|
|
| 2 |
Effect of Fair value through Other Comprehensive Income on Investment |
0.68 |
-15.22 |
|
|
|
| 3 |
Equity reported under Ind AS |
237.35 |
210.39 |
|
|
|
| 6 |
The company operate in one segment, hence no segment reporting is provided. |
| 7 |
Figures for the previous period have been regrouped/reclassified wherever necessary, to conform to current period’s classification. |
| For Trinity League India Limited |
|
| |
| General information about company |
| Scrip code |
531846 |
|
| Name of company |
TRINITY LEAGUE INDIA LIMITED |
| Class of security |
Equity |
| Date of start of financial year |
01 |
04 |
2017 |
| Date of end of financial year |
31 |
03 |
2018 |
| Date of board meeting when results were approved |
23 |
01 |
2018 |
| Date on which prior intimation of the meeting for considering financial results was informed to the exchange |
12 |
01 |
2018 |
| Description of presentation currency |
INR |
|
|
| Level of rounding used in financial results |
Lakhs |
|
|
| Reporting Quarter |
Third quarter |
|
|
| Nature of report standalone or consolidated |
Standalone |
|
|
| Whether results are audited or unaudited |
Unaudited |
For Current Quarter Only |
| Segment Reporting |
Single segment |
|
| Description of single segment |
Business Auxilory Services |
| Start time of board meeting |
11 |
00 |
HH:MM |
| End time of board meeting |
12 |
30 |
HH:MM |
|
|
|
|
|
| |
| Financial Results – Ind-AS |
| Particulars |
3 months/ 6 months ended (dd-mm-yyyy) |
Year to date figures for current period ended (dd-mm-yyyy) |
| A |
Date of start of reporting period |
01-10-2017 |
01-04-2017 |
| B |
Date of end of reporting period |
31-12-2017 |
31-12-2017 |
| C |
Whether results are audited or unaudited |
Unaudited |
Unaudited |
| D |
Nature of report standalone or consolidated |
Standalone |
Standalone |
| Part I |
Blue color marked fields are non-mandatory. For Consolidated Results, if the company has no figures for 3 months / 6 months ended, in such case zero shall be inserted in the said column. |
| 1 |
Income |
|
| |
Revenue from operations |
20.000 |
26.500 |
| |
Other income |
0.750 |
3.500 |
| |
Total income |
20.750 |
30.000 |
| 2 |
Expenses |
|
| (a) |
Cost of materials consumed |
0.000 |
0.000 |
| (b) |
Purchases of stock-in-trade |
0.000 |
0.000 |
| (c) |
Changes in inventories of finished goods, work-in-progress and stock-in-trade |
0.000 |
0.000 |
| (d) |
Employee benefit expense |
2.940 |
36.980 |
| (e) |
Finance costs |
0.000 |
0.000 |
| (f) |
Depreciation, depletion and amortisation expense |
0.730 |
2.200 |
| (f) |
Other Expenses |
|
| 1 |
Other Expenses |
1.690 |
5.980 |
| 2 |
|
|
|
| 3 |
|
|
|
| 4 |
|
|
|
| 5 |
|
|
|
| 6 |
|
|
|
| 7 |
|
|
|
| 8 |
|
|
|
| 9 |
|
|
|
| 10 |
|
|
|
| |
Total other expenses |
1.690 |
5.980 |
| |
Total expenses |
5.360 |
45.160 |
| 3 |
Total profit before exceptional items and tax |
15.390 |
-15.160 |
| 4 |
Exceptional items |
0.000 |
0.000 |
| 5 |
Total profit before tax |
15.390 |
-15.160 |
| 7 |
Tax expense |
|
| 8 |
Current tax |
0.000 |
0.000 |
| 9 |
Deferred tax |
0.000 |
0.000 |
| 10 |
Total tax expenses |
0.000 |
0.000 |
| 11 |
Net movement in regulatory deferral account balances related to profit or loss and the related deferred tax movement |
0.000 |
0.000 |
| 14 |
Net Profit Loss for the period from continuing operations |
15.390 |
-15.160 |
| 15 |
Profit (loss) from discontinued operations before tax |
0.000 |
0.000 |
| 16 |
Tax expense of discontinued operations |
0.000 |
0.000 |
| 17 |
Net profit (loss) from discontinued operation after tax |
0.000 |
0.000 |
| 19 |
Share of profit (loss) of associates and joint ventures accounted for using equity method |
0.000 |
0.000 |
| 21 |
Total profit (loss) for period |
15.390 |
-15.160 |
| 22 |
Other comprehensive income net of taxes |
0.000 |
0.000 |
| 23 |
Total Comprehensive Income for the period |
15.390 |
-15.160 |
| 24 |
Total profit or loss, attributable to |
|
| |
Profit or loss, attributable to owners of parent |
|
|
| |
Total profit or loss, attributable to non-controlling interests |
|
|
| 25 |
Total Comprehensive income for the period attributable to |
|
| |
Comprehensive income for the period attributable to owners of parent |
0.000 |
0.000 |
| |
Total comprehensive income for the period attributable to owners of parent non-controlling interests |
0.000 |
0.000 |
| 26 |
Details of equity share capital |
|
| |
Paid-up equity share capital |
|
|
| |
Face value of equity share capital |
|
|
| 27 |
Details of debt securities |
|
| |
Paid-up debt capital |
|
|
| |
Face value of debt securities |
|
|
| 28 |
Reserves excluding revaluation reserve |
|
|
| 29 |
Debenture redemption reserve |
|
|
| 30 |
Earnings per share |
|
| i |
Earnings per equity share for continuing operations |
|
| |
Basic earnings (loss) per share from continuing operations |
0.300 |
-0.030 |
| |
Diluted earnings (loss) per share from continuing operations |
0.300 |
-0.030 |
| ii |
Earnings per equity share for discontinued operations |
|
| |
Basic earnings (loss) per share from discontinued operations |
0.000 |
0.000 |
| |
Diluted earnings (loss) per share from discontinued operations |
0.000 |
0.000 |
| ii |
Earnings per equity share |
|
| |
Basic earnings (loss) per share from continuing and discontinued operations |
0.300 |
-0.030 |
| |
Diluted earnings (loss) per share from continuing and discontinued operations |
0.300 |
-0.030 |
| 31 |
Debt equity ratio |
|
|
| 32 |
Debt service coverage ratio |
|
|
| 33 |
Interest service coverage ratio |
|
|
| 34 |
Disclosure of notes on financial results |
|
|
|
|
|
|
|
| Format for Reporting Segmenet wise Revenue, Results and Capital Employed along with the company results |
| Particulars |
3 months/ 6 month ended (dd-mm-yyyy) |
Year to date figures for current period ended (dd-mm-yyyy) |
| Date of start of reporting period |
01-10-2017 |
01-04-2017 |
| Date of end of reporting period |
31-12-2017 |
31-12-2017 |
| Whether accounts are audited or unaudited |
Unaudited |
Unaudited |
| Nature of report standalone or consolidated |
Standalone |
Standalone |
| 1 |
Segment Revenue (Income) |
|
| |
(net sale/income from each segment should be disclosed) |
|
| 1 |
|
|
|
| 2 |
|
|
|
| 3 |
|
|
|
| 4 |
|
|
|
| 5 |
|
|
|
| 6 |
|
|
|
| 7 |
|
|
|
| 8 |
|
|
|
| 9 |
|
|
|
| 10 |
|
|
|
| 11 |
|
|
|
| 12 |
|
|
|
| 13 |
|
|
|
| 14 |
|
|
|
| 15 |
|
|
|
| |
Total Segment Revenue |
|
|
| |
Less: Inter segment revenue |
|
|
| |
Revenue from operations |
|
|
|
|
|
|
| 2 |
Segment Result |
|
| |
Profit (+) / Loss (-) before tax and interest from each segment |
|
| 1 |
|
|
|
| 2 |
|
|
|
| 3 |
|
|
|
| 4 |
|
|
|
| 5 |
|
|
|
| 6 |
|
|
|
| 7 |
|
|
|
| 8 |
|
|
|
| 9 |
|
|
|
| 10 |
|
|
|
| 11 |
|
|
|
| 12 |
|
|
|
| 13 |
|
|
|
| 14 |
|
|
|
| 15 |
|
|
|
| |
Total Profit before tax |
|
|
| |
i. Finance cost |
|
|
| |
ii. Other Unallocable Expenditure net off Unallocable income |
|
|
| |
Profit before tax |
|
|
|
|
|
|
| 3 |
Capital Employed |
|
| |
(Segment Asset - Segment Liabilities) |
|
| 1 |
|
|
|
| 2 |
|
|
|
| 3 |
|
|
|
| 4 |
|
|
|
| 5 |
|
|
|
| 6 |
|
|
|
| 7 |
|
|
|
| 8 |
|
|
|
| 9 |
|
|
|
| 10 |
|
|
|
| 11 |
|
|
|
| 12 |
|
|
|
| 13 |
|
|
|
| 14 |
|
|
|
| 15 |
|
|
|
| |
Total capital employed |
|
|
| |
Disclosure of notes on segments |
|
|
|
|
|
|
|
| Other Comprehensive Income |
| Particulars |
3 months/ 6 month ended (dd-mm-yyyy) |
Year to date figures for current period ended (dd-mm-yyyy) |
| A |
Date of start of reporting period |
01-10-2017 |
01-04-2017 |
| B |
Date of end of reporting period |
31-12-2017 |
31-12-2017 |
| C |
Whether results are audited or unaudited |
Unaudited |
Unaudited |
| D |
Nature of report standalone or consolidated |
Standalone |
Standalone |
| |
Other comprehensive income [Abstract] |
|
| 1 |
Amount of items that will not be reclassified to profit and loss |
|
| |
Total Amount of items that will not be reclassified to profit and loss |
|
|
| 2 |
Income tax relating to items that will not be reclassified to profit or loss |
0.000 |
0.000 |
| 3 |
Amount of items that will be reclassified to profit and loss |
|
| |
Total Amount of items that will be reclassified to profit and loss |
|
|
| 4 |
Income tax relating to items that will be reclassified to profit or loss |
0.000 |
0.000 |
| 5 |
Total Other comprehensive income |
0.000 |
0.000 |
|
| |
| General information about company |
| Scrip code |
531846 |
|
| Name of company |
TRINITY LEAGUE INDIA LIMTED |
| Class of security |
Equity |
| Date of start of financial year |
01 |
04 |
2017 |
| Date of end of financial year |
31 |
03 |
2018 |
| Date of board meeting when results were approved |
13 |
11 |
2017 |
| Date on which prior intimation of the meeting for considering financial results was informed to the exchange |
04 |
11 |
2017 |
| Description of presentation currency |
INR |
|
|
| Level of rounding used in financial results |
Lakhs |
|
|
| Reporting Quarter |
Half yearly |
|
|
| Nature of report standalone or consolidated |
Standalone |
|
|
| Whether results are audited or unaudited |
Unaudited |
For Current Quarter Only |
| Segment Reporting |
Single segment |
|
| Description of single segment |
Business Auxilory Services |
| Start time of board meeting |
11 |
00 |
HH:MM |
| End time of board meeting |
03 |
00 |
HH:MM |
|
| |
| Financial Results – Ind-AS |
| Particulars |
3 months/ 6 months ended (dd-mm-yyyy) |
Year to date figures for current period ended (dd-mm-yyyy) |
| A |
Date of start of reporting period |
01-07-2017 |
01-04-2017 |
| B |
Date of end of reporting period |
30-09-2017 |
30-09-2017 |
| C |
Whether results are audited or unaudited |
Unaudited |
Unaudited |
| D |
Nature of report standalone or consolidated |
Standalone |
Standalone |
| Part I |
Blue color marked fields are non mandatory.For Consolidated Results, if the company has no figures for 3 months / 6 months ended, in such case zero shall be inserted in the said column. |
| 1 |
Income |
|
| |
Revenue from operations |
0.000 |
6.500 |
| |
Other income |
2.750 |
2.750 |
| |
Total income |
2.750 |
9.250 |
| 2 |
Expenses |
|
| (a) |
Cost of materials consumed |
0.000 |
0.000 |
| (b) |
Purchases of stock-in-trade |
0.000 |
0.000 |
| (c) |
Changes in inventories of finished goods, work-in-progress and stock-in-trade |
0.000 |
0.000 |
| (d) |
Employee benefit expense |
9.860 |
34.040 |
| (e) |
Finance costs |
0.000 |
0.000 |
| (f) |
Depreciation, depletion and amortisation expense |
0.580 |
1.470 |
| (f) |
Other Expenses |
|
| 1 |
Other Expenses |
0.950 |
4.290 |
| 2 |
|
|
|
| 3 |
|
|
|
| 4 |
|
|
|
| 5 |
|
|
|
| 6 |
|
|
|
| 7 |
|
|
|
| 8 |
|
|
|
| 9 |
|
|
|
| 10 |
|
|
|
| |
Total other expenses |
0.950 |
4.290 |
| |
Total expenses |
11.390 |
39.800 |
| 3 |
Total profit before exceptional items and tax |
-8.640 |
-30.550 |
| 4 |
Exceptional items |
0.000 |
0.000 |
| 5 |
Total profit before tax |
-8.640 |
-30.550 |
| 7 |
Tax expense |
|
| 8 |
Current tax |
0.000 |
0.000 |
| 9 |
Deferred tax |
0.000 |
0.000 |
| 10 |
Total tax expenses |
0.000 |
0.000 |
| 11 |
Net movement in regulatory deferral account balances related to profit or loss and the related deferred tax movement |
0.000 |
0.000 |
| 14 |
Net Profit Loss for the period from continuing operations |
-8.640 |
-30.550 |
| 15 |
Profit (loss) from discontinued operations before tax |
0.000 |
0.000 |
| 16 |
Tax expense of discontinued operations |
0.000 |
0.000 |
| 17 |
Net profit (loss) from discontinued operation after tax |
0.000 |
0.000 |
| 19 |
Share of profit (loss) of associates and joint ventures accounted for using equity method |
0.000 |
0.000 |
| 21 |
Total profit (loss) for period |
-8.640 |
-30.550 |
| 22 |
Other comprehensive income net of taxes |
0.000 |
0.000 |
| 23 |
Total Comprehensive Income for the period |
-8.640 |
-30.550 |
| 24 |
Total profit or loss, attributable to |
|
| |
Profit or loss, attributable to owners of parent |
|
|
| |
Total profit or loss, attributable to non-controlling interests |
|
|
| 25 |
Total Comprehensive income for the period attributable to |
|
| |
Comprehensive income for the period attributable to owners of parent |
0.000 |
0.000 |
| |
Total comprehensive income for the period attributable to owners of parent non-controlling interests |
0.000 |
0.000 |
| 26 |
Details of equity share capital |
|
| |
Paid-up equity share capital |
|
|
| |
Face value of equity share capital |
|
|
| 27 |
Details of debt securities |
|
| |
Paid-up debt capital |
|
|
| |
Face value of debt securities |
|
|
| 28 |
Reserves excluding revaluation reserve |
|
|
| 29 |
Debenture redemption reserve |
|
|
| 30 |
Earnings per share |
|
| i |
Earnings per equity share for continuing operations |
|
| |
Basic earnings (loss) per share from continuing operations |
-0.170 |
-0.060 |
| |
Diluted earnings (loss) per share from continuing operations |
-0.170 |
-0.060 |
| ii |
Earnings per equity share for discontinued operations |
|
| |
Basic earnings (loss) per share from discontinued operations |
0.000 |
0.000 |
| |
Diluted earnings (loss) per share from discontinued operations |
0.000 |
0.000 |
| ii |
Earnings per equity share |
|
| |
Basic earnings (loss) per share from continuing and discontinued operations |
-0.170 |
-0.060 |
| |
Diluted earnings (loss) per share from continuing and discontinued operations |
-0.170 |
-0.060 |
| 31 |
Debt equity ratio |
|
|
| 32 |
Debt service coverage ratio |
|
|
| 33 |
Interest service coverage ratio |
|
|
| 34 |
Disclosure of notes on financial results |
|
|
|
|
|
|
|
| Statement of Asset and Liabilities |
| Particulars |
Half year ended (dd-mm-yyyy) |
Previous year ended (dd-mm-yyyy) |
| Date of start of reporting period |
01-04-2017 |
01-04-2016 |
| Date of end of reporting period |
30-09-2017 |
31-03-2017 |
| Whether results are audited or unaudited |
Unaudited |
Audited |
| Nature of report standalone or consolidated |
Standalone |
Standalone |
| |
| |
Assets |
|
| 1 |
Non-current assets |
|
| |
Property, plant and equipment |
7.810 |
9.280 |
| |
Capital work-in-progress |
0.000 |
0.000 |
| |
Investment property |
40.960 |
0.000 |
| |
Goodwill |
0.000 |
0.000 |
| |
Other intangible assets |
0.000 |
0.000 |
| |
Intangible assets under development |
0.000 |
0.000 |
| |
Biological assets other than bearer plants |
0.000 |
0.000 |
| |
Investments accounted for using equity method |
0.000 |
0.000 |
| |
Non-current financial assets |
|
| |
Non-current investments |
0.000 |
90.955 |
| |
Trade receivables, non-current |
0.000 |
0.000 |
| |
Loans, non-current |
25.000 |
0.000 |
| |
Other non-current financial assets |
0.000 |
0.000 |
| |
Total non-current financial assets |
25.000 |
90.955 |
| |
Deferred tax assets (net) |
0.480 |
0.482 |
| |
Other non-current assets |
2.950 |
0.000 |
| |
Total non-current assets |
77.200 |
100.717 |
| 2 |
Current assets |
|
| |
Inventories |
0.000 |
0.000 |
| |
Current financial asset |
|
| |
Current investments |
0.000 |
0.000 |
| |
Trade receivables, current |
108.490 |
114.810 |
| |
Cash and cash equivalents |
0.900 |
16.285 |
| |
Bank balance other than cash and cash equivalents |
25.320 |
0.000 |
| |
Loans, current |
0.000 |
6.058 |
| |
Other current financial assets |
2.500 |
0.000 |
| |
Total current financial assets |
137.210 |
137.153 |
| |
Current tax assets (net) |
0.000 |
0.000 |
| |
Other current assets |
0.720 |
0.000 |
| |
Total current assets |
137.930 |
137.153 |
| 3 |
Non-current assets classified as held for sale |
0.000 |
0.000 |
| 4 |
Regulatory deferral account debit balances and related deferred tax Assets |
0.000 |
0.000 |
| |
Total assets |
215.130 |
237.870 |
| |
Equity and liabilities |
|
| 1 |
Equity |
|
| |
Equity attributable to owners of parent |
|
| |
Equity share capital |
506.690 |
506.690 |
| |
Other equity |
-300.590 |
-270.026 |
| |
Total equity attributable to owners of parent |
206.100 |
236.664 |
| |
Non controlling interest |
|
|
| |
Total equity |
206.100 |
236.664 |
| 2 |
Liabilities |
|
| |
Non-current liabilities |
|
| |
Non-current financial liabilities |
|
| |
Borrowings, non-current |
0.000 |
0.000 |
| |
Trade payables, non-current |
0.000 |
0.000 |
| |
Other non-current financial liabilities |
0.000 |
0.000 |
| |
Total non-current financial liabilities |
0.000 |
0.000 |
| |
Provisions, non-current |
0.000 |
0.000 |
| |
Deferred tax liabilities (net) |
0.000 |
0.000 |
| |
Deferred government grants, Non-current |
0.000 |
0.000 |
| |
Other non-current liabilities |
0.000 |
0.000 |
| |
Total non-current liabilities |
0.000 |
0.000 |
| |
Current liabilities |
|
| |
Current financial liabilities |
|
| |
Borrowings, current |
0.000 |
0.000 |
| |
Trade payables, current |
0.070 |
0.000 |
| |
Other current financial liabilities |
8.960 |
0.000 |
| |
Total current financial liabilities |
9.030 |
0.000 |
| |
Other current liabilities |
0.000 |
1.206 |
| |
Provisions, current |
0.000 |
0.000 |
| |
Current tax liabilities (Net) |
0.000 |
0.000 |
| |
Deferred government grants, Current |
0.000 |
0.000 |
| |
Total current liabilities |
9.030 |
1.206 |
| 3 |
Liabilities directly associated with assets in disposal group classified as held for sale |
0.000 |
0.000 |
| 4 |
Regulatory deferral account credit balances and related deferred tax liability |
0.000 |
0.000 |
| |
Total liabilities |
9.030 |
1.206 |
| |
Total equity and liabilites |
215.130 |
237.870 |
| |
Disclosure of notes on assets and liabilities |
|
|
|
|
|
|
|
| |
| Format for Reporting Segmenet wise Revenue, Results and Capital Employed along with the company results |
| Particulars |
3 months/ 6 month ended (dd-mm-yyyy) |
Year to date figures for current period ended (dd-mm-yyyy) |
| Date of start of reporting period |
01-07-2017 |
01-04-2017 |
| Date of end of reporting period |
30-09-2017 |
30-09-2017 |
| Whether accounts are audited or unaudited |
Unaudited |
Unaudited |
| Nature of report standalone or consolidated |
Standalone |
Standalone |
| 1 |
Segment Revenue (Income) |
|
| |
(net sale/income from each segment should be disclosed) |
|
| 1 |
|
|
|
| 2 |
|
|
|
| 3 |
|
|
|
| 4 |
|
|
|
| 5 |
|
|
|
| 6 |
|
|
|
| 7 |
|
|
|
| 8 |
|
|
|
| 9 |
|
|
|
| 10 |
|
|
|
| 11 |
|
|
|
| 12 |
|
|
|
| 13 |
|
|
|
| 14 |
|
|
|
| 15 |
|
|
|
| |
Total Segment Revenue |
|
|
| |
Less: Inter segment revenue |
|
|
| |
Revenue from operations |
|
|
|
|
|
|
| 2 |
Segment Result |
|
| |
Profit (+) / Loss (-) before tax and interest from each segment |
|
| 1 |
|
|
|
| 2 |
|
|
|
| 3 |
|
|
|
| 4 |
|
|
|
| 5 |
|
|
|
| 6 |
|
|
|
| 7 |
|
|
|
| 8 |
|
|
|
| 9 |
|
|
|
| 10 |
|
|
|
| 11 |
|
|
|
| 12 |
|
|
|
| 13 |
|
|
|
| 14 |
|
|
|
| 15 |
|
|
|
| |
Total Profit before tax |
|
|
| |
i. Finance cost |
|
|
| |
ii. Other Unallocable Expenditure net off Unallocable income |
|
|
| |
Profit before tax |
|
|
|
|
|
|
| 3 |
Capital Employed |
|
| |
(Segment Asset - Segment Liabilities) |
|
| 1 |
|
|
|
| 2 |
|
|
|
| 3 |
|
|
|
| 4 |
|
|
|
| 5 |
|
|
|
| 6 |
|
|
|
| 7 |
|
|
|
| 8 |
|
|
|
| 9 |
|
|
|
| 10 |
|
|
|
| 11 |
|
|
|
| 12 |
|
|
|
| 13 |
|
|
|
| 14 |
|
|
|
| 15 |
|
|
|
| |
Total capital employed |
|
|
| |
Disclosure of notes on segments |
|
|
|
|
|
|
|
| Other Comprehensive Income |
| Particulars |
3 months/ 6 month ended (dd-mm-yyyy) |
Year to date figures for current period ended (dd-mm-yyyy) |
| A |
Date of start of reporting period |
01-07-2017 |
01-04-2017 |
| B |
Date of end of reporting period |
30-09-2017 |
30-09-2017 |
| C |
Whether results are audited or unaudited |
Unaudited |
Unaudited |
| D |
Nature of report standalone or consolidated |
Standalone |
Standalone |
| |
Other comprehensive income [Abstract] |
|
| 1 |
Amount of items that will not be reclassified to profit and loss |
|
| |
Total Amount of items that will not be reclassified to profit and loss |
|
|
| 2 |
Income tax relating to items that will not be reclassified to profit or loss |
0.000 |
0.000 |
| 3 |
Amount of items that will be reclassified to profit and loss |
|
| |
Total Amount of items that will be reclassified to profit and loss |
|
|
| 4 |
Income tax relating to items that will be reclassified to profit or loss |
0.000 |
0.000 |
| 5 |
Total Other comprehensive income |
0.000 |
0.000 |
|
| |
| TRINITY LEAGUE INDIA LIMITED |
|
June-2107 |
| CIN : L74999DL1988PLC031953 |
|
|
| Regd. Office : A-23, Mandakini Enclave, Alaknanda, New Delhi-110019 |
|
|
| Email ID for Investors : trinityleague@trinitygroup.ind.in |
|
|
| Statement of Unaudited Financial Results for the Quarter ended June 30, 2017 |
|
(In Lacs) |
| Sr. No. |
Particulars |
Quarter Ended 30.06.2017 |
Quarter Ended 30.06.2016 |
| |
|
Un audited |
Un audited |
| 1 |
Income |
|
|
| |
(a) Revenue from operations |
6.50 |
0.00 |
| |
b) Other Income |
- |
0.01 |
| |
Total Income (a+b) |
6.50 |
0.01 |
| 2 |
Expenses |
|
|
| |
a) Employee Cost |
24.18 |
2.54 |
| |
b) Deprecation and Amortisation expense |
0.89 |
0.96 |
| |
c) Other Expenses |
3.34 |
5.38 |
| |
Total expenses |
28.41 |
8.88 |
| 3 |
Profit / (Loss) before exceptional items & tax (1-2) |
(21.91) |
(8.87) |
| 4 |
Exceptional items |
- |
- |
| 5 |
Profit / (Loss) before tax (3-4) |
(21.91) |
(8.87) |
| 6 |
Tax expense : |
|
|
| |
Current Tax |
- |
- |
| |
Deffered Tax |
- |
- |
| 7 |
Net Profit / (Loss) for the period (5-6) |
(21.91) |
(8.87) |
| 8 |
Other comprehensive Income |
|
|
| 9 |
Total Comprehensive income for the period (7+8) |
(21.91) |
(8.87) |
| 10 |
Paid-up equity share capital (Face Value of Rs.10/- each) |
506.69 |
506.59 |
| 11 |
Earnings Per Share (of Rs 10/- each) (not annualized): |
|
|
| |
(a) Basic |
(0.43) |
(0.18) |
| |
(b) Diluted |
(0.43) |
(0.18) |
| Notes: |
|
|
|
| 1 |
Statement of unaudited results which have been reviewed by the Audit Committee of Board of Directors & approved by the Board of Directors in its meeting held on 3rd August, 2017 are being revised as the above statement was not being prepared in accordance with Indian Accounting Standards (Ind AS) notified under Companies (Indian Accounting Standards) Rules, 2015 which is applicable to company wef 1st April, 2017 and also the above statement was not presented in revised format as prescribed in SEBI’s Circular No. CIR/CFD/FAC/2016 dated 5th July 2016.
The revised statement of unaudited results have been reviewed by the Audit Committee of the Board of Directors in the meeting held on 3rd August, 2017 and approved by the Board of Directors in the meeting held on the same day. |
| 2 |
The statutory auditors of the company have carried out the limited review of the financial results for the quarter ended 30th June 2017 as required under Regulation 33 of the Securities and Exchange Board of India (Listing Obligations and Disclosure Requirements) Regulations, 2015. |
| 3 |
The company adopted Ind AS from 1st April 2017 and accordingly the financial results are prepared in accordance with Indian Accounting Standards (Ind AS) notified under Companies (Indian Accounting Standards) Rules 2015. The comparative figures for the quarter ended 30th June 2016 have been restated by the Management as per Ind AS and have not been subject to limited review or audit. However, the Management has exercised necessary due diligence to ensure that the financial results provide a true and fair view of the Company’s affairs. |
| 4 |
The financial results do not include figures for the preceding quarter and previous year ended 31st March, 2017 as per SEBI’s Circular No. CIR/CFD/FAC/2016 dated 5th July 2016. |
| 5 |
There is no difference in the net loss reported in accordance with Indian GAAP to total comprehensive income in accordance with Ind AS for the quarter ended 30th June 2016. Hence no reconciliation statement is prepared for reconciliation for net loss reported in previous GAAP to Ind AS. |
| 6 |
The company operate in one segment, hence no segment reporting is provided. |
| 7 |
Figures for the previous period have been regrouped/reclassified wherever necessary, to conform to current period’s classification. |
|
|
For Trinity League India Limited |
|
| |
| |
| TRINITY LEAGUE INDIA LIMITED |
| Regd. Office: A-23, Mandakini Enclave, Alaknanda, New Delhi-110019 |
| PART I |
|
| Statement of Audited Financial Results for the Quarter and Year ended 31st March, 2017 |
| S.No. |
Particulars |
THREE MONTHS ENDED |
YEAR ENDED |
| 31.03.2017 |
31.12.2016 |
31.03.2016 |
31.03.2017 |
31.03.2016 |
| Audited |
Unaudited |
Audited |
Audited |
Audited |
| |
|
|
|
|
|
|
| 1 |
Net Sales/Income from Operations |
14.70 |
- |
- |
14.70 |
50.05 |
| |
Other Operating Income |
|
|
|
|
|
| |
Total Income from Operations(net) |
14.70 |
- |
- |
14.70 |
50.05 |
| 2 |
Expenditure |
|
|
|
|
|
| |
a. (increase)/decrease in stock in trade |
- |
- |
- |
- |
- |
| |
b. Consumption of Raw Material/ Risk Mgmt. & Consultancy Charges |
- |
- |
- |
- |
- |
| |
c. Purchase of traded goods |
- |
- |
- |
- |
- |
| |
d. Employees Cost |
3.37 |
3.79 |
3.46 |
13.44 |
13.88 |
| |
e. Marketing Expenses |
- |
- |
0.50 |
- |
1.74 |
| |
f. Compounding Fees/ Reinstatement Charges |
- |
- |
- |
- |
- |
| |
g. Depreciation |
0.89 |
0.91 |
0.96 |
3.73 |
3.85 |
| |
h. Other Expenses |
0.73 |
3.11 |
2.93 |
12.13 |
18.37 |
| |
Total Expenses |
4.99 |
7.81 |
7.85 |
29.30 |
37.84 |
| 3 |
Profit from Operations before Other Income |
|
|
|
|
|
| |
Interest & Exceptional Items(1-2) |
9.71 |
(7.81) |
(7.85) |
(14.60) |
12.21 |
| 4 |
Other Income |
6.00 |
0.04 |
2.35 |
6.05 |
2.44 |
| 5 |
Profit before Interest & Exceptional Items (3+4) |
15.71 |
(7.77) |
(5.50) |
(8.55) |
14.65 |
| 6 |
Interest |
- |
- |
- |
- |
- |
| 7 |
Profit after Interest but before Exceptional |
|
|
|
|
|
| |
items (5-6) |
15.71 |
(7.77) |
(5.50) |
(8.55) |
14.65 |
| 8 |
Exceptional Items |
- |
- |
- |
- |
- |
| 9 |
Profit from Ordinary activities before tax (7+8) |
15.71 |
(7.77) |
(5.50) |
(8.55) |
14.65 |
| 10 |
Tax Expenses |
- |
- |
- |
- |
2.72 |
| 11 |
Net Profit from Ordinary activities after tax(9-10) |
15.71 |
(7.77) |
(5.50) |
(8.55) |
11.93 |
| 12 |
Extraordinary Item( net of tax expense) |
- |
- |
- |
- |
- |
| 13 |
Net Profit for the Period(11-12) |
15.71 |
(7.77) |
(5.50) |
(8.55) |
11.93 |
| 14 |
Paid up Equity Share Capital |
|
|
|
|
|
| |
( Face Value per share: Re. 10/-) |
506.69 |
506.69 |
487.57 |
506.69 |
487.57 |
| 15 |
Reserves excluding Revaluation Reserves |
- |
- |
- |
- |
- |
| |
|
|
|
|
|
|
| 16 |
Earnings per Share before Extraordinary items(not to be Annualized) |
|
|
|
|
|
| |
Basic EPS |
0.31 |
(0.15) |
(0.11) |
(0.17) |
0.24 |
| |
Diluted EPS |
0.31 |
(0.15) |
(0.11) |
(0.17) |
0.24 |
| |
Earnings per Share after Extraordinary items(not to be Annualized) |
|
|
|
|
|
| |
Basic EPS |
0.31 |
(0.15) |
(0.11) |
(0.17) |
0.24 |
| |
Diluted EPS |
0.31 |
(0.15) |
(0.11) |
(0.17) |
0.24 |
|
| |
| PART II |
|
| |
Information for the Quarter and Year ended 31.03.2017 |
| PARTICULARS |
THREE MONTHS ENDED |
YEAR ENDED |
| 31.03.2017 |
31.12.2016 |
31.03.2016 |
31.03.2017 |
31.03.2016 |
| Audited |
Unaudited |
Audited |
Audited |
Audited |
| A |
PARTICULARS OF SHAREHOLDING |
|
|
|
|
|
| |
|
|
|
|
|
|
| 1 |
Public Shareholding |
|
|
|
|
|
| |
Number of Shares |
24,00,900 |
24,00,900 |
24,00,900 |
24,00,900 |
24,00,900 |
| |
Percentage of Shareholdings |
47.38 |
47.38 |
49.24 |
47.38 |
49.24 |
| |
|
|
|
|
|
|
| 2 |
Promoters and Promoter Group Shareholding |
|
|
|
|
|
| |
a) Pledged/Encumbered |
|
|
|
|
|
| |
Number of Shares |
- |
- |
- |
- |
|
| |
Percentage of Shares( as a % of total |
|
|
|
|
|
| |
Shareholding of Promoter and Promoter Group) |
- |
- |
- |
- |
|
| |
Percentage of Shares( as a % of total Share |
- |
- |
- |
- |
|
| |
Capital of the Company) |
|
|
|
|
|
| |
b) Non-Encumbered |
|
|
|
|
|
| |
Number of Shares |
26,66,000 |
26,66,000 |
24,74,800 |
26,66,000 |
24,74,800 |
| |
Percentage of Shares (as % of Total shareholding of Promoter and promoter group) |
52.62 |
52.62 |
50.76 |
52.62 |
50.76 |
| |
|
|
|
|
|
|
| |
Percentage of Shares (as % of total share capital of the company) |
100.00 |
100.00 |
100.00 |
100.00 |
100.00 |
| |
|
|
|
|
|
|
| |
|
|
|
|
|
|
| |
Particulars |
|
Year Ended (31.03.2017) |
| |
| B |
INVESTOR COMPLAINTS |
|
|
| |
Pending at the beginning of the quarter |
|
0 |
| |
Received during the quarter |
|
0 |
| |
Disposed of during the quarter |
|
0 |
| |
Remaining unsolved at the end of the quarter |
|
0 |
|
| |
| Notes: |
|
| 1 |
The above results were reviewed by the Audit Committee and taken on record by the Board of Directors in their meetingheld on 24th May, 2017 and limited review of the same has been carried out by the statutory auditors of the company |
| 2 |
Figures of the previous period / year have been regrouped/re-arranged, wherever necessary |
| 3 |
The Company operates in one segment, hence no separate segment reporting is given. |
|
| |
| AUDITED STATEMENT OF ASSET & LIABILITY AS AT 31ST MARCH 2017 |
|
|
|
|
` in Lacs |
| Particulars |
|
|
As at March 31 |
| |
|
|
2017 |
2016 |
| |
|
|
Audited |
Audited |
| A. EQUITY AND LIABILITIES |
|
|
|
|
| 1. Shareholder's Fund |
|
|
|
|
| (a) Capital - Paid up Capital |
|
|
506.69 |
487.57 |
| |
|
|
|
|
| (b) Reserves & Surplus |
|
|
(270.51) |
(261.96) |
| 2. Current Liabilities |
|
|
|
|
| (a) Other Current Liabilities |
|
|
1.20 |
3.92 |
| TOTAL |
|
|
237.38 |
229.53 |
| |
|
|
|
|
| B. ASSETS |
|
|
|
|
| 1. Non Current Assets |
|
|
|
|
| (a) Fixed Assets |
|
|
9.28 |
13.00 |
| (b) Investments |
|
|
90.95 |
63.07 |
| 2. Current Assets |
|
|
|
|
| (a) Trade Receivables |
|
|
114.81 |
138.41 |
| (b) Cash and Cash equivalents |
|
|
16.29 |
5.05 |
| '(c) Short term loans & advances |
|
|
6.05 |
10.00 |
| TOTAL |
|
|
237.38 |
229.53 |
|
| |
| |
| TRINITY LEAGUE INDIA LIMITED |
|
| Regd. Office: A-23, Mandakini Enclave, Alaknanda, New Delhi-110019 |
|
| PART I |
|
| |
Statement of Unaudited Financial Results for the Quarter and Nine Month ended 31st December, 2016 |
` in Lacs |
| S.No. |
Particulars |
THREE MONTHS ENDED |
NINE MONTHS ENDED |
Year ended |
| 31.12.2016 |
30.09.2016 |
31.12.2015 |
31.12.2016 |
31.12.2015 |
31.03.2016 |
| Unaudited |
Unaudited |
Unaudited |
Unaudited |
Unaudited |
Audited |
| 1 |
Net Sales/Income from Operations |
- |
- |
- |
- |
50.05 |
50.05 |
| |
Other Operating Income |
|
|
|
|
|
|
| |
Total Income from Operations(net) |
- |
- |
- |
- |
50.05 |
50.05 |
| 2 |
Expenditure |
|
|
|
|
|
|
| |
a. (increase)/decrease in stock in trade |
- |
- |
- |
- |
- |
- |
| |
b. Consumption of Raw Material/ Risk Mgmt. & Consultancy Charges |
- |
- |
- |
- |
- |
- |
| |
c. Purchase of traded goods |
- |
- |
- |
- |
- |
- |
| |
d. Employees Cost |
3.79 |
2.59 |
3.97 |
8.69 |
10.57 |
13.88 |
| |
e. Marketing Expenses |
- |
- |
0.25 |
- |
1.24 |
1.74 |
| |
f. Compounding Fees/ Reinstatement Charges |
- |
- |
- |
- |
- |
- |
| |
g. Depreciation |
0.91 |
0.96 |
0.96 |
2.83 |
2.88 |
3.85 |
| |
h. Other Expenses |
3.11 |
4.06 |
1.82 |
12.79 |
15.24 |
18.37 |
| |
Total Expenses |
7.81 |
7.61 |
7.00 |
24.31 |
29.93 |
37.84 |
| 3 |
Profit from Operations before Other Income |
|
|
|
|
|
|
| |
Interest & Exceptional Items(1-2) |
(7.81) |
(7.61) |
(7.00) |
(24.31) |
20.12 |
12.21 |
| 4 |
Other Income |
0.04 |
- |
- |
0.05 |
0.08 |
2.44 |
| 5 |
Profit before Interest & Exceptional Items (3+4) |
(7.77) |
(7.61) |
(7.00) |
(24.26) |
20.20 |
14.65 |
| 6 |
Interest |
- |
- |
- |
- |
- |
- |
| 7 |
Profit after Interest but before Exceptional |
|
|
|
|
|
|
| |
items (5-6) |
(7.77) |
(7.61) |
(7.00) |
(24.26) |
20.20 |
14.65 |
| 8 |
Exceptional Items |
- |
- |
- |
- |
- |
- |
| 9 |
Profit from Ordinary activities before tax (7+8) |
(7.77) |
(7.61) |
(7.00) |
(24.26) |
20.20 |
14.65 |
| 10 |
Tax Expenses |
- |
- |
- |
- |
- |
2.72 |
| 11 |
Net Profit from Ordinary activities after tax(9-10) |
(7.77) |
(7.61) |
(7.00) |
(24.26) |
20.20 |
11.93 |
| 12 |
Extraordinary Item( net of tax expense) |
- |
- |
- |
- |
- |
- |
| 13 |
Net Profit for the Period(11-12) |
(7.77) |
(7.61) |
(7.00) |
(24.26) |
20.20 |
11.93 |
| 14 |
Paid up Equity Share Capital |
|
|
|
|
|
|
| |
( Face Value per share: Re. 10/-) |
506.69 |
506.69 |
487.57 |
506.69 |
487.57 |
487.57 |
| 15 |
Reserves excluding Revaluation Reserves |
- |
- |
- |
- |
- |
- |
| |
|
|
|
|
|
|
|
| 16 |
Earnings per Share before Extraordinary items(not to be Annualized) |
|
|
|
|
|
|
| |
Basic EPS |
(0.16) |
(0.15) |
(0.14) |
(0.48) |
0.41 |
0.24 |
| |
Diluted EPS |
(0.16) |
(0.15) |
(0.14) |
(0.48) |
0.41 |
0.24 |
| |
Earnings per Share after Extraordinary items(not to be Annualized) |
|
|
|
|
|
|
| |
Basic EPS |
(0.16) |
(0.15) |
(0.14) |
(0.48) |
0.41 |
0.24 |
| |
Diluted EPS |
(0.16) |
(0.15) |
(0.14) |
(0.48) |
0.41 |
0.24 |
| PART II |
|
| |
Information for the Quarter and Nine Month ended 31.12.2016 |
` in Lacs |
| PARTICULARS |
THREE MONTHS ENDED |
NINE MONTHS ENDED |
Year ended |
| 31.12.2016 |
30.09.16 |
31.12.2015 |
31.12.2016 |
31.12.2015 |
31.03.2016 |
| Unaudited |
Unaudited |
Unaudited |
Unaudited |
Unaudited |
Audited |
| A |
PARTICULARS OF SHAREHOLDING |
|
|
|
|
|
|
| |
|
|
|
|
|
|
|
| 1 |
Public Shareholding |
|
|
|
|
|
|
| |
Number of Shares |
2,400,900 |
2,400,900 |
2,400,900 |
2,400,900 |
2,400,900 |
2,400,900 |
| |
Percentage of Shareholdings |
47.38 |
47.38 |
49.24 |
47.38 |
49.24 |
49.24 |
| 2 |
Promoters and Promoter Group Shareholding |
|
|
|
|
|
|
| |
a) Pledged/Encumbered |
|
|
|
|
|
|
| |
Number of Shares |
- |
- |
- |
- |
|
- |
| |
Percentage of Shares( as a % of total |
|
|
|
|
|
|
| |
Shareholding of Promoter and Promoter Group) |
- |
- |
- |
- |
|
- |
| |
Percentage of Shares( as a % of total Share |
- |
- |
- |
- |
|
- |
| |
Capital of the Company) |
|
|
|
|
|
|
| |
b) Non-Encumbered |
|
|
|
|
|
|
| |
Number of Shares |
2,666,000 |
2,666,000 |
2,474,800 |
2,666,000 |
2,474,800 |
2,474,800 |
| |
Percentage of Shares (as % of Total shareholding of Promoter and promoter group) |
52.62 |
52.62 |
50.76 |
52.62 |
50.76 |
50.76 |
| |
Percentage of Shares (as % of total share capital of the company) |
100.00 |
100.00 |
100.00 |
100.00 |
100.00 |
100.00 |
| |
Particulars |
|
3 months ended (31.12.2016) |
| B |
INVESTOR COMPLAINTS |
|
|
| |
Pending at the beginning of the quarter |
|
0 |
| |
Received during the quarter |
|
0 |
| |
Disposed of during the quarter |
|
0 |
| |
Remaining unsolved at the end of the quarter |
|
0 |
| Notes: |
|
|
|
|
|
|
|
| 1 |
The above results were reviewed by the Audit Committee and taken on record by the Board of Directors in their meeting |
|
held on 24th January, 2017 and limited review of the same has been carried out by the statutory auditors of the company. |
| 2 |
Figures of the previous period / year have been regrouped/re-arranged, wherever necessary |
|
|
| 3 |
The Company operates in one segment, hence no separate segment reporting is given. |
|
|
| UNAUDITED STATEMENT OF ASSET & LIABILITY AS AT 31ST DECEMBER 2016 |
|
|
|
|
` in Lacs |
|
|
Particulars |
NINE MONTH ENDED DEC'16 |
|
|
|
|
|
|
31st Dec 2016 |
31st Dec 2015 |
31st March 2016 |
|
|
|
|
|
Unaudited |
Unaudited |
Audited |
|
|
A. EQUITY AND LIABILITIES |
|
|
|
|
|
|
|
1. Shareholder's Fund |
|
|
|
|
|
|
|
(a) Capital - Paid up Capital |
|
|
506.69 |
487.57 |
487.57 |
|
|
|
|
|
|
|
|
|
|
(b) Reserves & Surplus |
|
|
(286.23) |
(253.73) |
(261.96) |
|
|
2. Current Liabilities |
|
|
|
|
|
|
|
(a) Other Current Liabilities |
|
|
1.51 |
1.29 |
3.92 |
|
|
TOTAL |
|
|
221.97 |
235.13 |
229.53 |
|
|
B. ASSETS |
|
|
|
|
|
|
|
1. Non Current Assets |
|
|
|
|
|
|
|
(a) Fixed Assets |
|
|
10.18 |
13.97 |
13.01 |
|
|
(b) Investments |
|
|
35.95 |
60.95 |
63.07 |
|
|
2. Current Assets |
|
|
|
|
|
|
|
(a) Trade Receivables |
|
|
117.17 |
149.69 |
138.41 |
|
|
(b) Cash and Cash equivalents |
|
|
2.98 |
1.66 |
5.04 |
|
|
'(c) Short term loans & advances |
|
|
55.69 |
8.86 |
10.00 |
|
|
TOTAL |
|
|
221.97 |
235.13 |
229.53 |
|
|
| |
| TRINITY LEAGUE INDIA LIMITED |
| Regd. Office: A-23, Mandakini Enclave, Alaknanda, New Delhi-110019 |
| PART I |
|
| |
Statement of Unaudited Financial Results for the Quarter and Half Year ended 30th September, 2016 |
` in Lacs |
| S.No. |
Particulars |
THREE MONTHS ENDED |
SIX MONTHS ENDED |
Year ended |
| 30.09.2016 |
30.06.2016 |
30.09.2015 |
30.09.2016 |
30.09.2015 |
31.03.2016 |
| Unaudited |
Unaudited |
Unaudited |
Unaudited |
Unaudited |
Audited |
| |
|
|
|
|
|
|
|
| 1 |
Net Sales/Income from Operations |
- |
- |
- |
- |
50.05 |
50.05 |
| |
Other Operating Income |
|
|
|
|
|
|
| |
Total Income from Operations(net) |
- |
- |
- |
- |
50.05 |
50.05 |
| 2 |
Expenditure |
|
|
|
|
|
|
| |
a. (increase)/decrease in stock in trade |
- |
- |
- |
- |
- |
- |
| |
b. Consumption of Raw Material/ Risk Mgmt. & Consultancy Charges |
- |
- |
- |
- |
- |
- |
| |
c. Purchase of traded goods |
- |
- |
- |
- |
- |
- |
| |
d. Employees Cost |
2.59 |
2.54 |
3.30 |
5.13 |
6.48 |
13.88 |
| |
e. Marketing Expenses |
- |
- |
0.59 |
- |
0.96 |
1.74 |
| |
f. Compounding Fees/ Reinstatement Charges |
- |
- |
|
- |
- |
- |
| |
g. Depreciation |
0.96 |
0.96 |
0.96 |
1.92 |
1.92 |
3.85 |
| |
h. Other Expenses |
4.06 |
5.38 |
11.32 |
9.44 |
13.59 |
18.37 |
| |
Total Expenses |
7.61 |
8.88 |
16.17 |
16.49 |
22.95 |
37.84 |
| 3 |
Profit from Operations before Other Income |
|
|
|
|
|
|
| |
Interest & Exceptional Items(1-2) |
(7.61) |
(8.88) |
(16.17) |
(16.49) |
27.10 |
12.21 |
| 4 |
Other Income |
- |
- |
- |
- |
- |
2.44 |
| 5 |
Profit before Interest & Exceptional Items (3+4) |
(7.61) |
(8.88) |
(16.17) |
(16.49) |
27.10 |
14.65 |
| 6 |
Interest |
- |
0.01 |
- |
0.01 |
- |
- |
| 7 |
Profit after Interest but before Exceptional |
|
|
|
|
|
|
| |
items (5-6) |
(7.61) |
(8.87) |
(16.17) |
(16.48) |
27.10 |
14.65 |
| 8 |
Exceptional Items |
- |
- |
- |
- |
- |
- |
| 9 |
Profit from Ordinary activities before tax (7+8) |
(7.61) |
(8.87) |
(16.17) |
(16.48) |
27.10 |
14.65 |
| 10 |
Tax Expenses |
- |
- |
- |
- |
- |
2.72 |
| 11 |
Net Profit from Ordinary activities after tax(9-10) |
(7.61) |
(8.87) |
(16.17) |
(16.48) |
27.10 |
11.93 |
| 12 |
Extraordinary Item( net of tax expense) |
- |
- |
- |
- |
- |
- |
| 13 |
Net Profit for the Period(11-12) |
(7.61) |
(8.87) |
(16.17) |
(16.48) |
27.10 |
11.93 |
| 14 |
Paid up Equity Share Capital |
|
|
|
|
|
|
| |
( Face Value per share: Re. 10/-) |
506.69 |
506.69 |
487.57 |
506.69 |
487.57 |
487.57 |
| 15 |
Reserves excluding Revaluation Reserves |
- |
- |
- |
- |
- |
- |
| |
|
|
|
|
|
|
|
| 16 |
Earnings per Share before Extraordinary items(not to be Annualized) |
|
|
|
|
|
|
| |
Basic EPS |
(0.16) |
(0.18) |
(0.33) |
(0.33) |
0.56 |
0.24 |
| |
Diluted EPS |
(0.16) |
(0.18) |
(0.33) |
(0.33) |
0.56 |
0.24 |
| |
Earnings per Share after Extraordinary items(not to be Annualized) |
|
|
|
|
|
|
| |
Basic EPS |
(0.16) |
(0.18) |
(0.33) |
(0.33) |
0.56 |
0.24 |
| |
Diluted EPS |
(0.16) |
(0.18) |
(0.33) |
(0.33) |
0.56 |
0.24 |
|
| |
| PART II |
|
|
|
|
|
|
|
| |
Information for the Quarter and Half Year ended 30.09.2016 |
|
| |
PARTICULARS |
THREE MONTHS ENDED |
SIX MONTHS ENDED |
Year ended |
| 30.09.16 |
30.06.2016 |
30.09.2015 |
30.09.2016 |
30.09.2015 |
31.03.2016 |
| Unaudited |
Unaudited |
Unaudited |
Unaudited |
Unaudited |
Audited |
| A |
PARTICULARS OF SHAREHOLDING |
|
|
|
|
|
|
| |
|
|
|
|
|
|
|
| 1 |
Public Shareholding |
|
|
|
|
|
|
| |
Number of Shares |
24,00,900 |
24,00,900 |
24,00,900 |
24,00,900 |
24,00,900 |
24,00,900 |
| |
Percentage of Shareholdings |
47.38 |
47.38 |
49.24 |
47.38 |
49.24 |
49.24 |
| |
|
|
|
|
|
|
|
| 2 |
Promoters and Promoter Group Shareholding |
|
|
|
|
|
|
| |
a) Pledged/Encumbered |
|
|
|
|
|
|
| |
Number of Shares |
- |
- |
- |
- |
|
- |
| |
Percentage of Shares( as a % of total |
|
|
|
|
|
|
| |
Shareholding of Promoter and Promoter Group) |
- |
- |
- |
- |
|
- |
| |
Percentage of Shares( as a % of total Share |
- |
- |
- |
- |
|
- |
| |
Capital of the Company) |
|
|
|
|
|
|
| |
b) Non-Encumbered |
|
|
|
|
|
|
| |
Number of Shares |
26,66,000 |
26,66,000 |
24,74,800 |
26,66,000 |
24,74,800 |
24,74,800 |
| |
Percentage of Shares (as % of Total shareholding of Promoter and promoter group) |
52.62 |
52.62 |
50.76 |
52.62 |
50.76 |
50.76 |
| |
|
|
|
|
|
|
|
| |
Percentage of Shares (as % of total share capital of the company) |
100.00 |
100.00 |
100.00 |
100.00 |
100.00 |
100.00 |
| |
|
|
|
|
|
|
|
| |
|
|
|
|
|
|
|
| |
Particulars |
|
3 months ended (30.09.2016) |
| |
|
|
|
|
|
|
|
| B |
INVESTOR COMPLAINTS |
|
|
| |
Pending at the beginning of the quarter |
|
0 |
| |
Received during the quarter |
|
0 |
| |
Disposed of during the quarter |
|
0 |
| |
Remaining unsolved at the end of the quarter |
|
0 |
|
| |
| Notes: |
|
| 1 |
The above results were reviewed by the Audit Committee and taken on record by the Board of Directors in their meetingheld on 02nd November, 2016 and limited review of the same has been carried out by the statutory auditors of the company |
| 2 |
Figures of the previous period / year have been regrouped/re-arranged, wherever necessary |
| 3 |
The Company operates in one segment, hence no separate segment reporting is given. |
|
| |
| TRINITY LEAGUE INDIA LIMITED |
| Regd. Office: A-23, Mandakini Enclave, Alaknanda, New Delhi-110019 |
|
| PART I |
Statement of Un - Audited Financial Results for the Quarter ended 30th June, 2016 |
` in Lacs |
| S.No. |
Particulars |
THREE MONTHS ENDED |
Year ended |
| 30.06.2016 |
31.03.2016 |
30.06.2015 |
31.03.2016 |
| Unaudited |
Unaudited |
Unaudited |
Unaudited |
| |
|
|
|
|
|
| 1 |
Net Sales/Income from Operations |
- |
- |
50.05 |
50.05 |
| |
Other Operating Income |
|
- |
|
|
| |
Total Income from Operations(net) |
- |
- |
50.05 |
50.05 |
| 2 |
Expenditure |
|
|
|
|
| |
a. (increase)/decrease in stock in trade |
- |
- |
- |
- |
| |
b. Consumption of Raw Material/ Risk Mgmt. & Consultancy Charges |
- |
- |
- |
- |
| |
c. Purchase of traded goods |
- |
- |
- |
- |
| |
d. Employees Cost |
2.54 |
3.46 |
3.18 |
13.88 |
| |
e. Marketing Expenses |
- |
0.50 |
0.39 |
1.74 |
| |
f. Compounding Fees/ Reinstatement Charges |
- |
- |
- |
|
| |
g. Depreciation |
0.96 |
0.96 |
0.96 |
3.85 |
| |
h. Other Expenses |
5.38 |
2.93 |
2.21 |
18.37 |
| |
Total Expenses |
8.88 |
7.85 |
6.74 |
37.84 |
| 3 |
Profit from Operations before Other Income |
|
|
|
|
| |
Interest & Exceptional Items(1-2) |
(8.88) |
(7.85) |
43.31 |
12.21 |
| 4 |
Other Income |
- |
2.35 |
- |
2.44 |
| 5 |
Profit before Interest & Exceptional Items (3+4) |
(8.88) |
(5.50) |
43.31 |
14.65 |
| 6 |
Interest |
0.01 |
- |
- |
- |
| 7 |
Profit after Interest but before Exceptional |
|
|
|
|
| |
items (5-6) |
(8.87) |
(5.50) |
43.31 |
14.65 |
| 8 |
Exceptional Items |
- |
- |
- |
- |
| 9 |
Profit from Ordinary activities before tax (7+8) |
(8.87) |
(5.50) |
43.31 |
14.65 |
| 10 |
Tax Expenses |
- |
- |
- |
2.72 |
| 11 |
Net Profit from Ordinary activities after tax(9-10) |
(8.87) |
(5.50) |
43.31 |
11.93 |
| 12 |
Extraordinary Item( net of tax expense) |
- |
- |
- |
- |
| 13 |
Net Profit for the Period(11-12) |
(8.87) |
(5.50) |
43.31 |
11.93 |
| 14 |
Paid up Equity Share Capital |
|
|
|
|
| |
( Face Value per share: Re. 10/-) |
506.69 |
487.57 |
469.57 |
487.57 |
| 15 |
Reserves excluding Revaluation Reserves |
|
- |
|
- |
| |
|
|
|
|
|
| 16 |
Earnings per Share before Extraordinary items(not to be Annualized) |
|
|
|
|
| |
Basic EPS |
(0.18) |
(0.11) |
0.92 |
0.24 |
| |
Diluted EPS |
(0.18) |
(0.11) |
0.92 |
0.24 |
| |
Earnings per Share after Extraordinary items(not to be Annualized) |
|
|
|
|
| |
Basic EPS |
(0.18) |
(0.11) |
0.92 |
0.24 |
| |
Diluted EPS |
(0.18) |
(0.11) |
0.92 |
0.24 |
|
| |
| PART II |
Information for the Quarter ended 30.06.2016 |
| |
PARTICULARS |
THREE MONTHS ENDED |
Year ended |
| 30.06.2016 |
31.03.2016 |
30.06.2015 |
31.03.2016 |
| Unaudited |
Unaudited |
Unaudited |
Unaudited |
| A |
PARTICULARS OF SHAREHOLDING |
|
|
|
|
| |
|
|
|
|
|
| 1 |
Public Shareholding |
|
|
|
|
| |
Number of Shares |
2,400,900 |
2,400,900 |
2,220,900 |
2,400,900 |
| |
Percentage of Shareholdings |
47.38 |
49.24 |
47.30 |
49.24 |
| |
|
|
|
|
|
| 2 |
Promoters and Promoter Group Shareholding |
|
|
|
|
| |
a) Pledged/Encumbered |
|
|
|
|
| |
Number of Shares |
- |
- |
- |
- |
| |
Percentage of Shares( as a % of total |
|
|
|
|
| |
Shareholding of Promoter and Promoter Group) |
- |
- |
- |
- |
| |
Percentage of Shares( as a % of total Share |
- |
- |
- |
- |
| |
Capital of the Company) |
|
|
|
|
| |
b) Non-Encumbered |
|
|
|
|
| |
Number of Shares |
2,666,000 |
2,474,800 |
2,474,800 |
2,474,800 |
| |
Percentage of Shares (as % of Total shareholding of Promoter and promoter group) |
100.00 |
100.00 |
100.00 |
100.00 |
| |
|
|
|
|
|
| |
Percentage of Shares (as % of total share capital of the company) |
52.62 |
50.76 |
52.70 |
50.76 |
| |
|
|
|
|
|
| |
Particulars |
|
3 months ended (30.06.2016) |
| |
|
|
|
|
|
| B |
INVESTOR COMPLAINTS |
|
|
| |
Pending at the beginning of the quarter |
|
0 |
| |
Received during the quarter |
|
1 |
| |
Disposed of during the quarter |
|
1 |
| |
Remaining unsolved at the end of the quarter |
|
0 |
|
| Notes: |
| 1 |
The above results were reviewed by the Audit Committee and taken on record by the Board of Directors in their meetingheld on 03rd August, 2016 and limited review of the same has been carried out by the statutory auditors of the company |
| 2 |
Figures of the previous period / year have been regrouped/re-arranged, wherever necessary |
|
|
| 3 |
The Company operates in one segment, hence no separate segment reporting is given. |
|
|
|
|
| |
| TRINITY LEAGUE INDIA LIMITED |
| Regd. Office: A-23, Mandakini Enclave, Alaknanda, New Delhi-110019 |
| PART I |
Statement of Audited Financial Results for the Quarter and Year ended 31st March, 2016 |
` in Lacs |
| S.No. |
Particulars |
THREE MONTHS ENDED |
Year ended |
Year ended |
| 31.03.2016 |
31.12.2015 |
31.03.2015 |
31.03.2016 |
31.03.2015 |
| Audited |
UnAudited |
Audited |
Audited |
Audited |
| |
|
|
|
|
|
|
| 1 |
Net Sales/Income from Operations |
|
- |
- |
50.05 |
- |
| |
Other Operating Income |
- |
- |
- |
- |
- |
| |
Total Income from Operations(net) |
- |
- |
- |
50.05 |
- |
| 2 |
Expenditure |
|
|
|
|
|
| |
a. (increase)/decrease in stock in trade |
|
|
|
|
|
| |
b. Consumption of Raw Material/ Risk Mgmt. & Consultancy Charges |
- |
- |
- |
- |
- |
| |
c. Purchase of traded goods |
- |
- |
- |
- |
- |
| |
d. Employees Cost |
3.46 |
3.97 |
3.15 |
13.88 |
17.43 |
| |
e. Marketing Expenses |
0.50 |
0.25 |
0.60 |
1.74 |
1.72 |
| |
f. Compounding Fees/ Reinstatement Charges |
- |
- |
- |
- |
- |
| |
g. Depreciation |
0.96 |
0.96 |
0.96 |
3.85 |
3.71 |
| |
h. Other Expenses |
2.93 |
1.82 |
0.11 |
18.37 |
2.73 |
| |
Total Expenses |
7.85 |
7.00 |
4.82 |
37.84 |
25.59 |
| 3 |
Profit from Operations before Other Income |
|
|
|
|
|
| |
Interest & Exceptional Items(1-2) |
(7.85) |
(7.00) |
(4.82) |
12.21 |
(25.59) |
| 4 |
Other Income |
2.35 |
- |
0.03 |
2.44 |
0.33 |
| 5 |
Profit before Interest & Exceptional Items (3+4) |
(5.50) |
(7.00) |
(4.79) |
14.65 |
(25.26) |
| 6 |
Interest |
- |
- |
- |
- |
- |
| 7 |
Profit after Interest but before Exceptional |
|
|
|
|
|
| |
items (5-6) |
(5.50) |
(7.00) |
(4.79) |
14.65 |
(25.26) |
| 8 |
Exceptional Items |
- |
- |
- |
- |
(0.15) |
| 9 |
Profit from Ordinary activities before tax (7+8) |
(5.50) |
(7.00) |
(4.79) |
14.65 |
(25.11) |
| 10 |
Tax Expenses |
- |
- |
- |
2.72 |
- |
| 11 |
Net Profit from Ordinary activities after tax(9-10) |
(5.50) |
(7.00) |
(4.79) |
11.93 |
(25.11) |
| 12 |
Extraordinary Item( net of tax expense) |
- |
- |
- |
- |
- |
| 13 |
Net Profit for the Period(11-12) |
(5.50) |
(7.00) |
(4.79) |
11.93 |
(25.11) |
| 14 |
Paid up Equity Share Capital |
|
|
|
|
|
| |
( Face Value per share: Re. 10/-) |
487.57 |
487.57 |
469.57 |
487.57 |
469.57 |
| 15 |
Reserves excluding Revaluation Reserves |
- |
- |
- |
- |
- |
| |
|
|
|
|
|
|
| 16 |
Earnings per Share before Extraordinary items(not to be Annualized) |
|
|
|
|
|
| |
Basic EPS |
(0.11) |
(0.14) |
(0.10) |
0.24 |
(0.53) |
| |
Diluted EPS |
(0.11) |
(0.14) |
(0.10) |
0.24 |
(0.53) |
| |
Earnings per Share after Extraordinary items(not to be Annualized) |
|
|
|
|
|
| |
Basic EPS |
(0.11) |
(0.14) |
(0.10) |
0.24 |
(0.53) |
| |
Diluted EPS |
(0.11) |
(0.14) |
(0.10) |
0.24 |
(0.53) |
|
| |
| PART II |
|
|
|
|
|
|
| Information for the Quarter ended 31st March, 2016 |
| |
PARTICULARS |
THREE MONTHS ENDED |
Year ended |
Year ended |
| 31.03.2016 |
31.12.2015 |
31.03.2015 |
31.03.2016 |
31.03.2015 |
| Audited |
Unaudited |
Audited |
Audited |
Audited |
| A |
PARTICULARS OF SHAREHOLDING |
|
|
|
|
|
| |
|
|
|
|
|
|
| 1 |
Public Shareholding |
|
|
|
|
|
| |
Number of Shares |
2,400,900 |
2,220,900 |
2,454,900 |
2,400,900 |
2,454,900 |
| |
Percentage of Shareholdings |
49.24 |
47.30 |
52.28 |
49.24 |
52.28 |
| |
|
|
|
|
|
|
| 2 |
Promoters and Promoter Group Shareholding |
|
|
|
|
|
| |
a) Pledged/Encumbered |
|
|
|
|
|
| |
Number of Shares |
- |
- |
- |
- |
- |
| |
Percentage of Shares( as a % of total |
|
|
|
|
|
| |
Shareholding of Promoter and Promoter Group) |
- |
- |
- |
- |
- |
| |
Percentage of Shares( as a % of total Share |
- |
- |
- |
- |
- |
| |
Capital of the Company) |
|
|
|
|
|
| |
b) Non-Encumbered |
|
|
|
|
|
| |
Number of Shares |
2,474,800 |
2,474,800 |
2,240,800 |
2,474,800 |
2,240,800 |
| |
Percentage of Shares (as % of Total shareholding of Promoter and promoter group) |
100.00 |
100.00 |
100.00 |
100.00 |
100.00 |
| |
|
|
|
|
|
|
| |
Percentage of Shares (as % of total share capital of the company) |
50.76 |
50.76 |
47.72 |
50.76 |
47.72 |
| |
|
|
|
|
|
|
| |
Particulars |
|
Year ended (31.03.2016) |
| |
|
|
|
|
|
|
| B |
INVESTOR COMPLAINTS |
|
|
| |
Pending at the beginning of the quarter |
|
0 |
| |
Received during the quarter |
|
0 |
| |
Disposed of during the quarter |
|
0 |
| |
Remaining unsolved at the end of the quarter |
|
0 |
|
| |
| |
| AUDITED STATEMENT OF ASSET & LIABILITY AS AT 31ST MARCH 2016 |
|
|
|
|
|
Rs.in Lacs |
| Particulars |
|
As at March 31 |
| |
|
|
2016 |
2015 |
| |
|
|
Audited |
Audited |
| A. EQUITY AND LIABILITIES |
|
|
|
| 1. Shareholder's Fund |
|
|
|
| (a) Capital - Paid up Capital |
|
487.57 |
469.57 |
| |
|
|
|
|
| (b) Reserves & Surplus |
|
(261.96) |
(273.89) |
| 2. Current Liabilities |
|
|
|
| (a) Other Current Liabilities |
|
3.92 |
1.03 |
| TOTAL |
|
|
229.53 |
196.71 |
| |
|
|
|
|
| B. ASSETS |
|
|
|
| 1. Non Current Assets |
|
|
|
| (a) Fixed Assets |
|
13.00 |
16.85 |
| (b) Non-Current Investment |
|
63.07 |
- |
| 2. Current Assets |
|
|
|
| (a) Trade Receivables |
|
138.41 |
169.69 |
| (b) Cash and Cash equivalents |
|
5.05 |
5.91 |
| '(c) Short term loans & advances |
|
10.00 |
4.26 |
| TOTAL |
|
|
229.53 |
196.71 |
|
| |
| Notes: |
|
|
|
|
|
|
| 1 |
The above results were reviewed by the Audit Committee and taken on record by the Board of Directors in their meeting |
|
held on 20.05.2016 |
| 2 |
Details of number of investors complaints for the quarter ended 31st March , 2016: Beginning - Nil Received - Nil |
|
Disposed off - Nil, Pending - Nil |
| 3 |
Figures of the previous period / year have been regrouped/re-arranged, wherever necessary |
| 4 |
The name of the company has been changed to " Trinity League India Ltd." w.e.f. 30.07.2012. |
|
|
| Date : |
20.05.2016 |
For Trinity League India Limited |
|
| Place : New Delhi |
|
|
|
|
|
|
|
|
|
D.K. Jain |
|
|
|
|
|
|
(Managing Director) |
|
|
|
| |
Standalone Results
| Type |
Un-Audited |
Un-Audited |
Un-Audited |
Audited |
Un-Audited |
Audited |
| Period Ending |
31-Dec-15 |
30-Sep-15 |
30-Jun-15 |
31-Mar-15 |
31-Dec-14 |
31-Mar-15 |
| No. of Months |
3 |
3 |
3 |
3 |
3 |
12 |
| Description |
Amount (Rs. million) |
| Net Sales / Interest Earned / Operating Income |
0.00 |
0.00 |
5.01 |
0.00 |
0.00 |
0.00 |
| Other Income |
0.00 |
0.00 |
0.00 |
0.00 |
0.03 |
0.03 |
| Expenditure |
-0.60 |
-1.52 |
-0.57 |
-0.38 |
-0.52 |
-2.17 |
| Profit Before Depreciation and Tax |
-0.60 |
-1.52 |
4.44 |
-0.38 |
-0.49 |
-2.14 |
| Depreciation |
-0.10 |
-0.10 |
-0.10 |
-0.10 |
-0.10 |
-0.37 |
| Profit before Tax |
-0.70 |
-1.62 |
4.33 |
-0.48 |
-0.60 |
-2.51 |
| Net Profit |
-0.70 |
-1.62 |
4.33 |
-0.48 |
-0.60 |
-2.51 |
| Equity Capital |
48.76 |
48.76 |
46.96 |
46.96 |
46.96 |
46.96 |
| Basic EPS after Extraordinary items |
-0.14 |
-0.33 |
0.92 |
-0.10 |
- |
-0.53 |
| Diluted EPS after Extraordinary items |
-0.14 |
-0.33 |
0.92 |
-0.10 |
- |
-0.53 |
| Nos. of Shares - Public |
0.00 |
28,63,000.00 |
22,20,900.00 |
26,83,000.00 |
26,83,000.00 |
26,83,000.00 |
| Percent of Shares-Public |
0.00 |
58.71 |
47.29 |
57.14 |
57.14 |
57.14 |
| Operating Profit Margin |
- |
- |
88.62 |
- |
- |
- |
| Net Profit Margin |
- |
- |
86.43 |
- |
- |
- |
| Cash EPS |
-0.12 |
-0.31 |
0.94 |
-0.08 |
-0.11 |
-0.46 |
|
| Security Code : |
531846 |
|
Company Name : |
TRINITY LEAGUE INDIA LTD. |
Detailed Results
| Type |
Un-Audited |
| Date Begin |
01-Oct-15 |
| Date End |
31-Dec-15 |
| Description |
Amount (Rs. million) |
| Net Sales |
0.00 |
| Expenditure |
-0.70 |
| Depreciation |
-0.10 |
| Employees Cost |
-0.40 |
| Marketing Expenses |
-0.03 |
| Other Expenditure |
-0.18 |
| Profit from Operations before Other Income, Interest and Exceptional Items |
-0.70 |
| Other Income |
0.00 |
| Profit before Interest and Exceptional Items |
-0.70 |
| Interest |
0.00 |
| Profit after Interest but before Exceptional Items |
-0.70 |
| Exceptional Item |
0.00 |
| Profit (+)/ Loss (-) from Ordinary Activities before Tax |
-0.70 |
| Tax |
0.00 |
| Net Profit (+)/ Loss (-) from Ordinary Activities after Tax |
-0.70 |
| Extraordinary Items |
0.00 |
| Net Profit |
-0.70 |
| Equity Capital |
48.76 |
| Face Value (in Rs) |
10.00 |
| Reserves |
0.00 |
| EPS before Extraordinary items (in Rs) |
|
| EPS after Extraordinary items (in Rs) |
|
| Number of Public Shareholding |
0.00 |
| Percentage of Public Shareholding |
0.00 |
| Promoters and Promoter Group Shareholding |
|
| Pledged / Encumbered |
|
| Basic EPS before Extraordinary items |
-0.14 |
| Diluted EPS before Extraordinary items |
-0.14 |
| Number of Shares |
0.00 |
| Basic EPS after Extraordinary items |
-0.14 |
| Diluted EPS after Extraordinary items |
-0.14 |
| % of the total of promoter & promoter group |
0.00 |
| % of the total share capital of the company |
0.00 |
| Non-encumbered |
|
| Number of Shares |
0.00 |
| % of the total of promoter & promoter group |
0.00 |
| % of the total share capital of the company |
0.00 |
|
| Security Code : |
531846 |
|
Company Name : |
TRINITY LEAGUE INDIA LTD. |
Standalone Results
| Type |
Un-Audited |
Un-Audited |
Audited |
Un-Audited |
Un-Audited |
Audited |
| Period Ending |
30-Sep-15 |
30-Jun-15 |
31-Mar-15 |
31-Dec-14 |
30-Sep-14 |
31-Mar-15 |
| No. of Months |
3 |
3 |
3 |
3 |
3 |
12 |
| Description |
Amount (Rs. million) |
| Net Sales / Interest Earned / Operating Income |
0.00 |
5.01 |
0.00 |
0.00 |
0.00 |
0.00 |
| Other Income |
0.00 |
0.00 |
0.00 |
0.03 |
0.00 |
0.03 |
| Expenditure |
-1.52 |
-0.57 |
-0.38 |
-0.52 |
-0.60 |
-2.17 |
| Interest |
0.00 |
0.00 |
0.00 |
0.00 |
-0.01 |
0.00 |
| Profit Before Depreciation and Tax |
-1.52 |
4.44 |
-0.38 |
-0.49 |
-0.61 |
-2.14 |
| Depreciation |
-0.10 |
-0.10 |
-0.10 |
-0.10 |
-0.09 |
-0.37 |
| Profit before Tax |
-1.62 |
4.33 |
-0.48 |
-0.60 |
-0.70 |
-2.51 |
| Net Profit |
-1.62 |
4.33 |
-0.48 |
-0.60 |
-0.70 |
-2.51 |
| Equity Capital |
48.76 |
46.96 |
46.96 |
46.96 |
46.96 |
46.96 |
| Basic EPS after Extraordinary items |
-0.33 |
0.92 |
-0.10 |
- |
- |
-0.53 |
| Diluted EPS after Extraordinary items |
-0.33 |
0.92 |
-0.10 |
- |
- |
-0.53 |
| Nos. of Shares - Public |
28,63,000.00 |
22,20,900.00 |
26,83,000.00 |
26,83,000.00 |
26,83,000.00 |
26,83,000.00 |
| Percent of Shares-Public |
58.71 |
47.29 |
57.14 |
57.14 |
57.14 |
57.14 |
| Operating Profit Margin |
- |
88.62 |
- |
- |
- |
- |
| Net Profit Margin |
- |
86.43 |
- |
- |
- |
- |
| Cash EPS |
-0.31 |
0.94 |
-0.08 |
-0.11 |
-0.13 |
-0.46 |
|
| Security Code : |
531846 |
|
Company Name : |
TRINITY LEAGUE INDIA LTD. |
Detailed Results
| Type |
Un-Audited |
| Date Begin |
01-Jul-15 |
| Date End |
30-Sep-15 |
| Description |
Amount (Rs. million) |
| Net Sales |
0.00 |
| Net Sales / Income from Operations |
0.00 |
| Expenditure |
-1.62 |
| Depreciation |
-0.10 |
| Employees Cost |
-0.33 |
| Marketing Expenses |
-0.06 |
| Other Expenditure |
-1.13 |
| Profit from Operations before Other Income, Interest and Exceptional Items |
-1.62 |
| Other Income |
0.00 |
| Profit before Interest and Exceptional Items |
-1.62 |
| Interest |
0.00 |
| Profit after Interest but before Exceptional Items |
-1.62 |
| Exceptional Item |
0.00 |
| Profit (+)/ Loss (-) from Ordinary Activities before Tax |
-1.62 |
| Tax |
0.00 |
| Net Profit (+)/ Loss (-) from Ordinary Activities after Tax |
-1.62 |
| Extraordinary Items |
0.00 |
| Net Profit |
-1.62 |
| Equity Capital |
48.76 |
| Face Value (in Rs) |
10.00 |
| Reserves |
0.00 |
| EPS before Extraordinary items (in Rs) |
|
| EPS after Extraordinary items (in Rs) |
|
| Number of Public Shareholding |
28,63,000.00 |
| Percentage of Public Shareholding |
58.71 |
| Promoters and Promoter Group Shareholding |
|
| Pledged / Encumbered |
|
| Basic EPS before Extraordinary items |
-0.33 |
| Diluted EPS before Extraordinary items |
-0.33 |
| Number of Shares |
0.00 |
| Basic EPS after Extraordinary items |
-0.33 |
| Diluted EPS after Extraordinary items |
-0.33 |
| % of the total of promoter & promoter group |
0.00 |
| % of the total share capital of the company |
0.00 |
| Non-encumbered |
|
| Number of Shares |
20,12,700.00 |
| % of the total of promoter & promoter group |
100.00 |
| % of the total share capital of the company |
41.28 |
|
| Standalone Results |
|
| Security Code : |
531846 |
|
Company Name : |
TRINITY LEAGUE INDIA LTD. |
|
|
| Type |
Un-Audited |
Audited |
Un-Audited |
Un-Audited |
Un-Audited |
Audited |
| Period Ending |
30-Jun-15 |
31-Mar-15 |
31-Dec-14 |
30-Sep-14 |
30-Jun-14 |
31-Mar-15 |
| No. of Months |
3 |
3 |
3 |
3 |
3 |
12 |
|
|
|
| Description |
Amount (Rs. million) |
| Net Sales / Interest Earned / Operating Income |
5.01 |
0.00 |
0.00 |
0.00 |
0.00 |
0.00 |
| Other Income |
0.00 |
0.00 |
0.03 |
0.00 |
0.00 |
0.03 |
| Expenditure |
-0.57 |
-0.38 |
-0.52 |
-0.60 |
-0.35 |
-2.17 |
| Interest |
0.00 |
0.00 |
0.00 |
-0.01 |
0.00 |
0.00 |
| Profit Before Depreciation and Tax |
4.44 |
-0.38 |
-0.49 |
-0.61 |
-0.35 |
-2.14 |
| Depreciation |
-0.10 |
-0.10 |
-0.10 |
-0.09 |
-0.09 |
-0.37 |
| Profit before Tax |
4.33 |
-0.48 |
-0.60 |
-0.70 |
-0.44 |
-2.51 |
| Net Profit |
4.33 |
-0.48 |
-0.60 |
-0.70 |
-0.44 |
-2.51 |
| Equity Capital |
46.96 |
46.96 |
46.96 |
46.96 |
46.96 |
46.96 |
| Basic EPS after Extraordinary items |
0.92 |
-0.10 |
- |
- |
- |
-0.53 |
| Diluted EPS after Extraordinary items |
0.92 |
-0.10 |
- |
- |
- |
-0.53 |
| Nos. of Shares - Public |
22,20,900.00 |
26,83,000.00 |
26,83,000.00 |
26,83,000.00 |
26,83,000.00 |
26,83,000.00 |
| Percent of Shares-Public |
47.29 |
57.14 |
57.14 |
57.14 |
57.14 |
57.14 |
| Operating Profit Margin |
88.62 |
- |
- |
- |
- |
- |
| Net Profit Margin |
86.43 |
- |
- |
- |
- |
- |
| Cash EPS |
0.94 |
-0.08 |
-0.11 |
-0.13 |
-0.07 |
-0.46 |
| Notes |
Notes |
Notes |
Notes |
Notes |
Notes |
Notes |
|
|
| Note : |
1. The results displayed here are as furnished by the company at the relevant point of time. |
|
2. Operating Profit Margin, Net Profit Margin and Cash EPS is calculated and not furnished by the company. |
|
3. Quarterly, Half Yearly, Annual will be displayed for current period and 3 immediately preceding periods. |
|
4. Where no data is available for any of the immediately preceding period, then there will be no display for that period. |
|
|
| |
|
| Detailed Results |
|
| |
|
| Type |
Un-Audited |
| Date Begin |
01-Apr-15 |
| Date End |
30-Jun-15 |
|
|
| |
|
| Net Sales / Income from Operations |
5.01 |
| Net Sales / Income from Operations |
5.01 |
| Expenditure |
-0.67 |
| Depreciation |
-0.10 |
| Employees Cost |
-0.32 |
| Marketing Expenses |
-0.04 |
| Other Expenditure |
-0.22 |
| Profit from Operations before Other Income, Interest and Exceptional Items |
4.33 |
| Other Income |
0.00 |
| Profit before Interest and Exceptional Items |
4.33 |
| Interest |
0.00 |
| Profit after Interest but before Exceptional Items |
4.33 |
| Exceptional Items |
0.00 |
| Profit (+)/ Loss (-) from Ordinary Activities before Tax |
4.33 |
| Tax |
0.00 |
| Net Profit (+)/ Loss (-) from Ordinary Activities after Tax |
4.33 |
| Extraordinary Items |
0.00 |
| Net Profit |
4.33 |
| Equity Capital |
46.96 |
| Face Value (in Rs) |
10.00 |
| Reserves |
0.00 |
| EPS before Extraordinary items (in Rs) |
|
| Basic EPS before Extraordinary items |
0.92 |
| Diluted EPS before Extraordinary items |
0.92 |
| EPS after Extraordinary items (in Rs) |
|
| Basic EPS after Extraordinary items |
0.92 |
| Diluted EPS after Extraordinary items |
0.92 |
| Number of Public Shareholding |
22,20,900.00 |
| Percentage of Public Shareholding |
47.29 |
| Promoters and Promoter Group Shareholding |
|
| Pledged / Encumbered |
|
| Number of Shares |
0.00 |
| Percentage of Shares (as a % of the total shareholding of promoter and promoter group) |
0.00 |
| Percentage of Shares (as a% of the total share capital of the company) |
0.00 |
| Non-encumbered |
|
| Number of Shares |
24,74,800.00 |
| Percentage of Shares (as a% of the total shareholding of promoter & prom group) |
100.00 |
| Percentage of Shares (as a % of the total share capital of the company) |
52.70 |
|
|
| Note : The results displayed here are as furnished by the company at the relevant point of time. |
|
|
| |
|
| Standalone Results |
|
| Security Code : |
531846 |
|
Company Name : |
TRINITY LEAGUE INDIA LTD. |
March 2015
| |
|
|